《财富》调查:科技行业中哪些公司最烧钱?
|
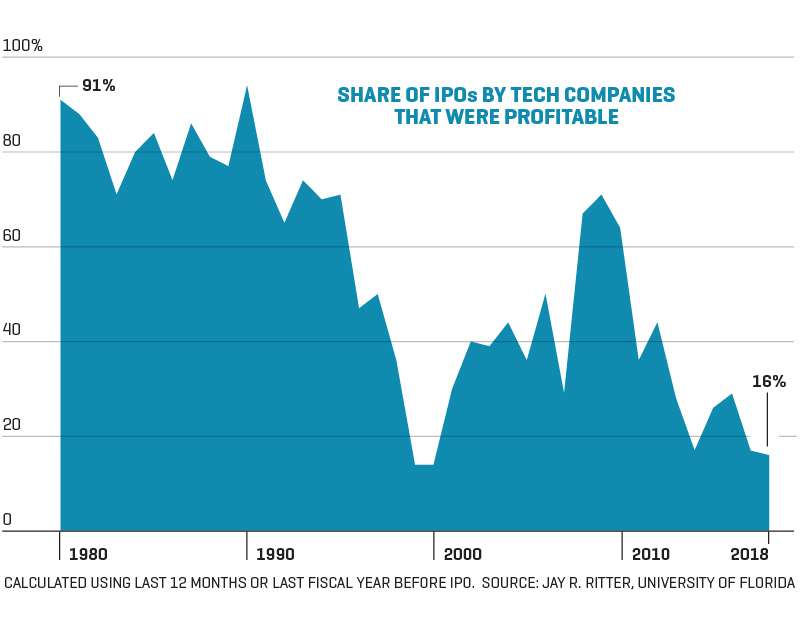
“要想挣钱就得先花钱”,这句话是有史以来得到最广泛认可的商界格言之一,而硅谷对于这句格言的膜拜程度更是到了无以复加的地步。在那里,特斯拉、Uber、Lyft和Snap秉持着“自己终究有一天会挣钱”的信仰,获得了令人眩晕的估值。这些公司的支持者们让我们看到,筹集数十亿美元的运营资金是实现这一目标的必经之路。毕竟,像亚马逊、苹果、Facebook和谷歌之类的巨头在盈利之前不也是挥金如土吗? 《财富》杂志决定对此进行调查:亚马逊、苹果、Facebook和谷歌在其发展初期耗费了多少资金?作为对比,当今的那些热门公司又烧了多少钱?为了获得这一数字,我们翻阅了每家公司最初发布的财报,并从其首次公开募股的发售声明中着手。 事实证明,成功科技公司在其成立初期会耗费大量资金的设想不仅仅只是错了,而是错的离谱。让我们来看看硅谷四巨头亚马逊、苹果、Facebook和谷歌(如今母公司是Alphabet)发展初期的数字。你会发现,与现今的新生代(我们又称之为“烧钱能手”:特斯拉、Uber、Lyft和Snap)相比,它们都是资金节约方面的楷模。 事实在于,在21世纪初的互联网热期间,很多科技公司一边吸收着新资金,一边报着业绩亏损。但真正烧钱的失败案例是Webvan和eToys.com这类公司,而不是谷歌这样的赢家。如今,会计专业人士杰克·西斯尔斯基说:“尽管有很多公司吃掉了无数座金山,但投资者的比对对象并不是互联网时代的那些失败者,而是幸存者。” 此次分析的关键指标并非是净盈利,而是“自由现金流”,其计算方法是用“运营活动产生的现金”减去资本支出,也就是用企业的收入减去企业用在发展方面的花销。 差别十分明显。以谷歌为例。令人吃惊的是,该公司似乎从来没有出现过高额的负现金流。同样,作为一家成熟的公司,苹果从创建之初以来也从未出现过自由现金流为负的情况,而且它仅经历过短暂的赤字问题。Facebook仅出现过两年的负自由现金流状况(2007年和2008年,当时烧掉了1.43亿美元)。 说到用今天的亏损换取明日的利润,亚马逊可谓是这一方面的典范,但其数字看起来较为奇怪。公司刚成立时(1994-1997)的自由现金流为负1060万美元,但这仅占总销售额的很小一部分。其历史上唯一重大“溺水”事件发生在1999-2001年期间,当时其自有现金流达到了负8.13亿美元。但是到了2002年,亚马逊的自由现金流又变成了正值。综上所述,硅谷四巨头在创建初期的负自由现金流总额差不多刚好10亿美元。 |
“You’ve got to spend money to make money” is one of the most widely accepted business adages of all time. And nowhere is that belief more innate than in Silicon Valley, where companies like Tesla, Uber, Lyft, and Snap command dizzying valuations based on the belief that one day, they will indeed make money. Raising fresh billions to fund operations, boosters of these companies would have us believe, is a regular rite of passage. After all, didn’t giants like Amazon, Apple, Facebook, and Google also burn through tons of cash on their path to profitability? Fortune decided to find out: How much money did Amazon, Apple, Facebook, and Google spend in their early years? And how does that compare with what today’s hot names are spending? To get the numbers, we went back to each company’s earliest published financial reports, starting with the offering statements for its IPO. It turns out the assumption that successful tech companies burned lots of cash in their youth isn’t merely wrong—it’s staggeringly wrong. Look closely at the early days of the giants—the Fab Four, as we’ll call Amazon, Apple, Facebook, and Google (now Alphabet), and you’ll see that they were models of frugality compared with the new wave (which we’ll dub the Breakneck Burners: Tesla, Uber, Lyft, and Snap). It’s true that in the dotcom frenzy of the early 2000s, many tech companies posted losses while devouring new funding. But the ones that burned piles of cash were such failures as Webvan and eToys.com, not winners like Google. Today, says accounting expert Jack Ciesielski, “you’ve got these companies chewing through mountains of cash, and investors are comparing them not with the failures of the dotcom era but with the survivors.” For this analysis, the crucial measure isn’t net profit but “free cash flow” (FCF), calculated by taking “cash generated by operating activities” minus capital expenditures (capex). In other words, business income minus money you spent to grow your business. The differences are stark. Let’s start with Google. Amazingly, the company appears never to have been significantly cash flow negative. Similarly, Apple never showed negative free cash flow starting with its first full year in business and weathered only short-lived deficits as a mature player. Facebook showed just two years of negative FCF (in 2007 and 2008, when it burned $143 million). At Amazon, long the poster child for taking losses today to earn profits tomorrow, the numbers seem almost quaint. The new venture had negative FCF of $10.6 million from 1994 to 1997, but that was just a fraction of total sales. The only major underwater span in its history came from 1999 to 2001, when negative FCF totaled $813 million. But by 2002, Amazon’s FCF turned positive. All told, the Fab Four had total negative free cash flow in their early years of almost exactly $1 billion. |
|
作为对比,烧钱能手们则已经挥霍了239亿美元,也就是共计22年的自由现金流赤字,其支出总额是硅谷四巨头的20倍。按照这个节奏,他们能否给投资者带来回报?以下是对各家公司的展望。 特斯拉 已烧金额(负自由现金流总额):12年期间109亿美元 展望:2017年负自由现金流总额增至41亿美元,但第二年有所减少,达到了(相对)较为温和的2.22亿美元。这一态势并未持续多久,因为特斯拉开始花重金提升其大众市场Model 3车型的产能。今年一季度,公司的销售额出现下滑,自由现金流跌至负9.45亿美元,迫使特斯拉以股权和债务融资的形式筹集了24亿美元。摩根士丹利的亚当·乔纳斯以特斯拉在华销售放缓为由,将此前对特斯拉股价的“熊市预期”从97美元下调至10美元,让市场感到震惊。乔纳斯警告称,总体需求的下降将推迟特斯拉能够通过运营实现自给自足的日期。 乔纳斯的目标股价(所有目标价均为从现在开始12个月后的股价):230美元 当前股价:216美元 Uber 已烧金额:3年89亿美元(不计最初年份的亏损) 展望:在今年5月公司期待已久的IPO发售声明中,Uber公布了2016-2018年的自由现金流数字。2016年,Uber来自运营的现金为负29亿美元,资本开支为16亿美元,也就是45亿美元的负自由现金流。自那之后,这一差额一直在收窄,但仍然是个不小的数字,因为公司一直在向客户提供价格补贴,并投入大量的资金用于推出 Uber Eats送餐服务,此举让2018年和2019年一季度的营销费用分别提升了25%和54%。经纪公司D.A. Davidson的汤姆·怀特向《财富》杂志透露:“Uber最近良好的营收和订单业绩为自己争取了一些时间,但到今年年底,投资者会开始把2020年看作是希望之年,也就是Uber应该能够在盈利方面取得一些实质性的进展。”他还说,如果Uber在接下来的几个季度并没有做到这一点,投资者将“感到沮丧或失去耐心”。 怀特的目标股价:46美元 当前价格:42.33美元 Lyft 已烧金额:3年零一个季度13.6亿美元(不计最初年份的亏损,IPO招股书中并未明确提及) 展望:2016年,Lyft烧掉了4.96亿美元的自由现金流。自那之后,这一态势也只是稍有改善。2018年,缺口略有收窄,降至3.5亿美元,然而今年一季度又达到了 1.1亿美元。Lyft属于轻资产公司,但公司依然在一些基础性项目方面投入了大量的资金,例如司机费用、保险、研发和营销,以至于运营亏损一直在不断扩大。Wolfe Research公司的丹·加尔福斯指出,Lyft近60%的业务都来自于人口密集的市区市场,但这些地区的家庭数仅占美国家庭总数的5%。他指出,这些都市区的年增速已经降至24%,只有2018年年初的一半。加尔福斯还表示,高昂的司机成本“几乎相当于整个营收额”。他对Lyft在大城市之外的广泛吸引力表示怀疑。 加尔福斯的目标股价:52美元 当前股价:58.32美元 Snap 已烧金额:4年27.2亿美元(不计未被列入IPO报备文件的最初年份亏损) 展望:Snap依然背负着沉重的研发开支,后者占到了其总成本的三分之一。今年,公司拓展其照片分享平台所需的研发资金额预计将跃升至9亿多美元。此外,我们不妨对比一下Snap所烧现金与出售自身服务所获得的资金,这一点很有启发意义。从2017年伊始到今年第一季度,Snap斩获了23.3亿美元的营收,其中73%都是现金,也就是17.1亿美元。Wedbush公司的迈克·帕克特指出,尽管用户数和营收增长十分喜人,但“通往盈利的道路似乎变长了”。他担心,在基础设施和研发方面的巨大开支会至少会让Snap息税折旧摊销前利润转正的日子延后至2020年第四季度。 帕克特的目标股价:12.25美元 当前股价:13.62美元(财富中文网) 本文另一版本登载于《财富》杂志2019年7月刊,标题为《最厉害的烧钱能手》。 译者:冯丰 审校:夏林 |
By contrast, the Burners have already torn through $23.9 billion, encompassing 22 years of FCF deficits and outspending the Fab Four by around 20 to 1. At this pace, will they ever reward investors? Here’s the outlook for each. Tesla Cash burn (total negative FCF): $10.9 billion over 12 years. Outlook: Negative FCF ballooned to $4.1 billion in 2017 but narrowed the following year to a (comparatively) modest $222 million. The reprieve was short-lived, as Tesla began to spend heavily to ramp up production of its mass-market Model 3. In the first quarter of this year, sales tumbled, and FCF fell to minus $945 million, forcing Tesla to raise $2.4 billion in equity and debt funding. Morgan Stanley’s Adam Jonas shocked the markets by lowering his previous “bear case” for Tesla’s stock price from $97 to $10, citing dangers of slowing sales in China. Jonas warned that declining overall demand is pushing back the date when Tesla will be able to fund itself from operations. Jonas’s price target (all targets are for 12 months from now): $230 Current price: $216 Uber Cash burn: $8.9 billion over three years (not including losses from earliest years). Outlook: In the offering statement to its long-awaited IPO in May, Uber revealed FCF numbers from 2016 through 2018. In 2016, Uber posted negative cash from operations of $2.9 billion and spent $1.6 billion in ¬capex, for a negative FCF of $4.5 billion. Since then, the shortfalls have been shrinking, although they have remained substantial as the company has offered price promotions to customers and spent heavily on the launch of its Uber Eats food-delivery service, raising sales and marketing expenses by 25% in 2018 and 54% in Q1 of 2019. Tom White of brokerage D.A. Davidson tells Fortune, “Uber has bought itself some time with good recent performance on revenue and bookings. But by the end of this year, investors will start thinking of 2020 as hopefully the year where meaningful progress is made toward profitability.” If quarters keep slipping by without concrete progress, he adds, investors “will get discouraged or impatient.” White’s price target: $46 Current price: $42.33 Lyft Cash burn: $1.36 billion over three years and one quarter (not including losses from earliest years, which were not specified in the IPO prospectus). Outlook: In 2016, Lyft burned $496 million in FCF, and since then, the trajectory has improved only slightly. The shortfall shrank a bit to $350 million in 2018, but in Q1 of this year, it stood at $110 million. Lyft is asset-light, but it’s still spending so heavily on such basics as driver pay, insurance, R&D, and marketing that operating losses have continued to mount. Dan Galves of Wolfe Research points out that Lyft depends on dense urban markets for nearly 60% of its business, despite those areas making up only 5% of U.S. households. And annual growth in those metro areas, he reckons, has slowed to 24%, half the rate in early 2018. Galves also cites high driver costs that “are taking almost all the revenue” and doubts that Lyft will win broad appeal outside the big cities. Galves’s price target: $52 Current price: $58.32 Snap Cash burn: $2.72 billion over four years (not including losses from earliest years, which were not in IPO filings). Outlook: Snap is still burdened by big research expenses, equal to one-third of its total costs, and R&D needed to expand its photo-sharing platform is expected to jump to over $900 million this year. Additionally, it’s instructive to look at how much cash Snap is burning in relation to all the money it collects marketing its service. From the start of 2017 through Q1 of this year, Snap had $2.33 billion in revenues and churned through 73% of that amount, $1.71 billion in cash. Michael Pachter of Wedbush notes that although user and revenue growth is impressive, “the road to profitability appears to have gotten longer.” He’s concerned that big spending on ¬infrastructure and R&D has pushed back the date when Snap will show positive Ebitda to at least Q4 of 2020. Pachter’s price target: $12.25 Current price: $13.62 A version of this article appears in the July 2019 issue of Fortune with the headline “The Biggest Burners.” |