美国已出现经济衰退指标,市场下行还有多远
|
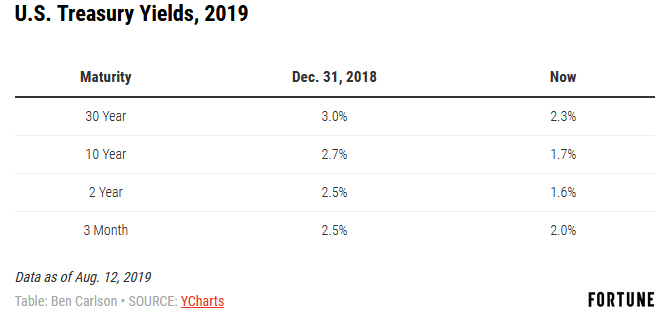
对于金融市场的参与者来说,今年的最大意外之一,就是利率的大幅下降。《华尔街日报》今年1月曾经对69名经济学家进行过调查,没有一个人预见到10年期国债利率到6月时会跌破2.5%(实际上,6月的10年期国债利率已经迫近2%)。这些专家的平均预测值是3%。实际上,它目前已经逼近了1.7%。 10年期国债利率是人们衡量利率环境时最经常使用的一个指标。不过当它出现变动时,其它期限的国债收益率并不会以平行的方式跟着变动。所以虽然今年10年期国债的利率出现了跳水,但是其他国债的利率并未呈现同等剧烈的波动,特别是那些短期国债。现在就让我们来看看,2019年年初以来,美国不同期限的国债的利率的变动情况: |
One of the biggest surprises to market participants this year has been the big move lower in interest rates. When the Wall Street Journal polled 69 economists in January, not a single one predicted 10 year treasury rates would fall below 2.5% by June (the actual rate was closer to 2% by then). The average forecast from this group of experts was 3%. The 10 year is currently yielding close to 1.7%. The 10 year is the benchmark most people look at when gauging the interest rate environment but when yields move they never do so in a parallel manner across the different maturities. So even as the 10 year has dropped like a rock in 2019, other parts of the yield curve haven't moved as much, most notably, rates that are shorter in duration. Here is a look at how various maturities in U.S. treasuries have changed from the start of 2019: |
|
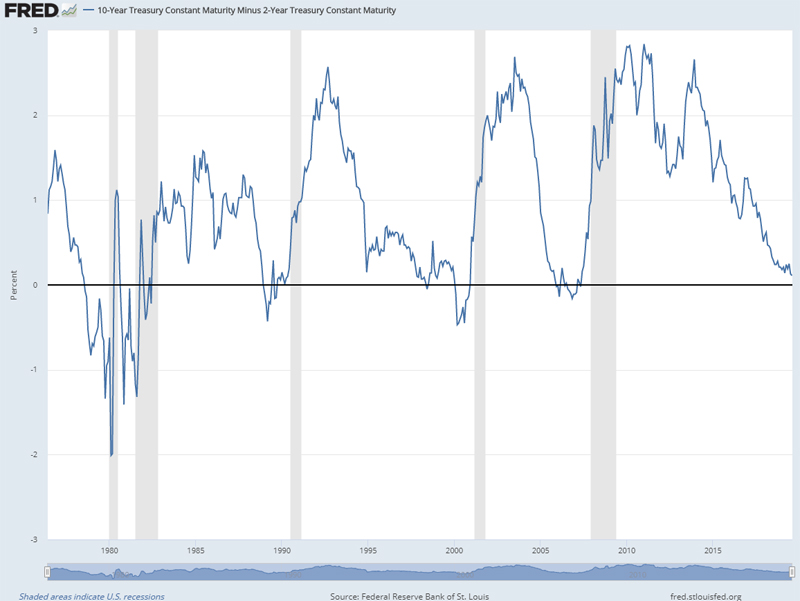
从上图中我们可以注意到,3个月的短期国债收益率已经超过了10年期和2年期国债的利率,而30年期国债正在迅速逼近2%大关。大家都知道,在“正常”环境下,长期国债利率必然高于短期,原因很简单,持有的时间长了,投资者就必然要承担更多的风险和更大的波动。 长期国债利率和短期国债利率之间的差异又被称为收益率曲线。在一个健康的经济环境中,这条曲线应该是向上倾斜的。而当债券投资者对经济放缓感到担忧时,这条曲线就会发生翻转,即短期国债的收益率高于长期国债。早在20世纪70年代末,收益率曲线翻转就被当作预示经济衰退即将来临的一个可靠指标了。 |
You’ll notice 3 month t-bills yields now exceed the 10 year and 2 year rates while the 30 year is fast approaching the 2% threshold. In a “normal” environment we would expect longer-term rates to be higher than short-term rates for the simple fact that investors must accept more duration risk, or volatility, in their bonds by going further out on the maturity spectrum. The difference between long-term rates and short-term rates is called the yield curve. In a healthy economic environment, it should be upward sloping. When bond investors become worried about the economy slowing, it tends to invert, where short-term bonds yield more than long-term bonds. Going back to the late-1970s, an inverted yield curve has been a reliable indicator of a coming recession: |
|
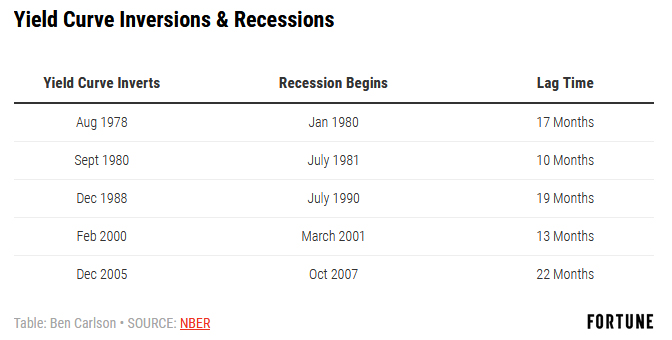
那么,这个信号一旦出现,多久后便会发生经济衰退呢?这个倒不一定,只不过每次发生了10年国债利率低于2年国债利率的情况,经济衰退最终总会发生。从收益率曲线反转到衰退开始发生,平均间隔时间大约为17个月左右,具体到每一次的时间则稍有不同。 |
This signal hasn’t worked on a set schedule but every time the 10 year treasury has yielded less than the 2 year treasury, a recession has shown up eventually. The average lag time is roughly 17 months from the time the yield curve inverts until the onset of a recession, but the timing of the results can vary. |
|
在经济衰退时期,股市的表现自然好不到哪去,所以每次短期国债利率超过长期国债利率时,投资者都想知道这对他们的股票意味着什么。 尤金·法玛和肯·弗兰奇最近发表了一篇题为《反向收益率曲线与预期股票回报》的研究论文。作者在此研究中收集的数据可以回溯到1975年,涵盖了11个主要的股票和债券市场,以确定当收益率曲线翻转时,证券市场的表现是否还不如短期国债(短期国债几乎可以算作现金的一种替代模式)。他们比较了6种不同的收益率曲线,当任何一条收益率曲线翻转时,就将股市资金抽出投入国债。然后他们会对未来1年、2年、3年和5年进行观察,看看从股市转移到国债市场后会发生什么。 两名作者的结论是:“我们未发现有证据表明当反向收益率曲线出现时,股市表现在1年、2年、3年和5年的预测周期内会逊于美国国债。”他们选取了三个广域市场进行对比,分别是美国股市、全球股市,以及除了美国之外的全球股市。在美国股市和全球股市的全部24个反向收益率曲线的案例中,从股票转向国债(现金)的策略,都不如“买入+持有”的做多策略。在除美国之外的全球市场的24个收益率曲线反转的案例中,也有19个案例出现了同样的结果。 没有人知道将来收益率曲线是否会成为一个可靠的经济指标。毕竟信心才是市场的基石,光是投资者知道了有这么一个信号的简单事实,就有可能改变其未来的预测作用。 不过即便有事实表明反向收益率曲线真的是预测经济衰退的一个可靠指标,它也不太可能帮助你在股市里捞到一笔。股市和经济的步调很少是一致的。因此,尽管反向收益率曲线的出现,意味着未来几年很可能会出现经济衰退,但这并不意味着你可以用它来判断进入股市的时机。(财富中文网) 本文作者本·卡尔森(Ben Carlson)是里萨兹财富管理公司(Ritholtz Wealth Management)的机构资产管理总监、注册金融分析师。 译者:朴成奎 |
Recessionary periods typically aren’t great for the stock market so as we enter an environment where short-term bonds yield more than long-term bonds, investors are wondering what this means for their stocks. Eugene Fama and Ken French recently published a research paper on the topic called Inverted Yield Curve and Expected Stock Returns. Fama and French took their dataset back to 1975, across 11 major stock and bond markets to determine if an inverted yield curve could predict the stock market underperforming short-term treasury bills (a proxy for cash). They compared six different yield spreads, switching from stocks to t-bills when any of these yield curves inverted. Then they looked out over the next one, two, three, and five year periods to see what happened when switching from stocks to cash. The duo’s conclusion states that, “We find no evidence that inverted yield curves predict stocks will underperform Treasury bills for forecast periods of one, two, three, and five years.” They compared three broad market indexes, using the U.S. stock market, the World stock market, and the World ex-U.S. stock market. The switching strategy of going from stocks to cash underperformed a long-only buy and hold strategy in all 24 instances using the U.S. and World markets. The yield curve signal also underperformed in 19 of 24 World ex-U.S. backtests. No one knows if the yield curve will work as a reliable economic indicator going forward. It’s possible the simple fact that investors are now aware of this signal could alter its usefulness going forward. But even if an inverted yield curve does prove itself as a reliable recessionary indicator, the data doesn’t necessarily allow you to take advantage in the stock market on a consistent basis. The stock market and the economy rarely move in lock-step with one another. So while an inverted yield curve could mean we see a recession sometime in the next couple of years, that doesn’t make it any easier to time the stock market. Ben Carlson, CFA is the Director of Institutional Asset Management at Ritholtz Wealth Management. |