如果经济形势大好,为何GDP增速如此之低?
|
当今所谓放眼历史都堪称强劲的经济形势,缺少了一个关键因素:井喷的GDP数据。 在上个世纪的后半叶,美国商务部发布的一些GDP报告令人印象深刻。从1950年到2000年,每个十年里最高的年度真实GDP增速如下:8.7%(1950年)、6.6%(1966年)、5.6%(1973年和1978年)、7.3%(1984年)和4.7%(1999年)。与21世纪的情况相比,这些数据高得夸张。2001年至2010年间,美国最高的真实GDP增速为3.8%(2004年);从2011年至今,最高的增速为2.9%,发生过两次(2015年和2018年)。 像美国这样复杂的经济体,绝非一个数据所能概括,不过以下一些因素有助于解释为什么GDP增速不如从前。 经济已经成熟 Bannockburn Global Forex的首席市场战略官马克·钱德勒表示:“我们是一个成熟的经济体,我们有65%的消费贡献给了服务业。对比中国,他们在过去20年里消费的水泥量比美国过去200年里还多。”这可以引申出一个模式:经济体会优先投入固定资产,它们对经济增长具有强大的促进作用。固定资产包括道路、高速公路和楼房。“假设你要建立一个家庭。首先,你得买房,随后购置家具和电视。在此之后你会购买服务。”按照这种模式,我们走到了今天,成为了一个以服务业为主的经济体。 钱德勒表示:“技术正在改变一切。通用汽车(GM)如今可以在20个工时内造出一辆汽车。如今在装配线上的工人制造几辆汽车的耗时只是他祖父的零头。他触碰的也是电脑屏幕,而不是汽车部件。” 他指出,新技术——想想互联网和高科技——节省了资本与人力。“所以在过去,你可能需要买台电脑来代替打字机(后者曾经取代了钢笔或铅笔),但如今你可以购买新的应用,而不必再买新电脑了。”你有了更多的计算能力,但你不再需要花费那么多钱。 负债水平过高 Charles Schwab and Co.的首席市场策略师利兹·安·桑德斯认为大萧条后的高负债水平也是原因之一。“这个循环不仅是后债务泡沫循环——它通常需要十多年来恢复——而且更广泛地说,负债水平,尤其是联邦政府和企业的负债水平,已经处于最高级别。随着债务越积越高,经济增长会渐渐走低。” 高负债影响经济增长的部分原因在于个人、公司和政府偿还债务会产生“挤出效应”。她表示:“高负债压缩了对于生产资料的投资,减少了经济支出和其他支出。”许多家庭过去十年里都在偿付金融危机后留下的债务,“这就意味着贡献给GDP的支出会有所减少。” 劳动力老化 房利美(Fannie Mae)的高级副总裁和首席经济学家道格·邓肯观察到,第二次世界大战之后的经济扩张受到了“婴儿潮一代”成长为劳动力和组建家庭的推动。其中包括女性参加工作的人数增多,并在2000年达到顶峰。更多的女性成为劳动力,就有了更多可以挣钱的人,也就产生了更多消费者,从而推动了真实GDP的增长。但是如今,随着婴儿潮一代的男男女女以每天1万人的速度跨过65岁大关,由此导致的劳动力减少并不能够被完全弥补。 此外,邓肯表示:“迁入美国的移民速度有所降低,这也减缓了劳动力的增长。”这也部分解释了为什么如今美国空缺工作岗位的数量(按照美国劳工统计局发布的工作岗位报告,为740万个)比能够参加工作的人数(按照就业形势报告,目前美国的失业人口是590万人)要多出150万。 政府监管 邓肯还认为,近年来的政府监管也抑制了商业投资,直到特朗普当局大幅放缓了监管法规的发布速度并削减了税率。他表示:“此举导致小型企业的信心出现了有记载以来最大幅度的增长。不过当局也在增加支出,已经处于高水平的债务与GDP的比率又有攀升。此外,关于关税的讨论每天都在变化,这又给企业投资计划平添了几分不确定性,你只能做好减缓增长的准备。” 无论近年来GDP增速放缓的原因是什么,特朗普当局对未来几年GDP年均增速的预测还是高达4%。有些人认为,更高的真实GDP增速会导致进入繁荣与萧条循环的风险加大。美联储也在经济有复苏迹象的第一时间开始权衡降低利率以促进增长的做法,结论可能最快会在下一次美联储会议(7月30日和31日)上确定。高速增长的前景或许只是存在于我们国家年轻时期的美好回忆。(财富中文网) 译者:严匡正 |
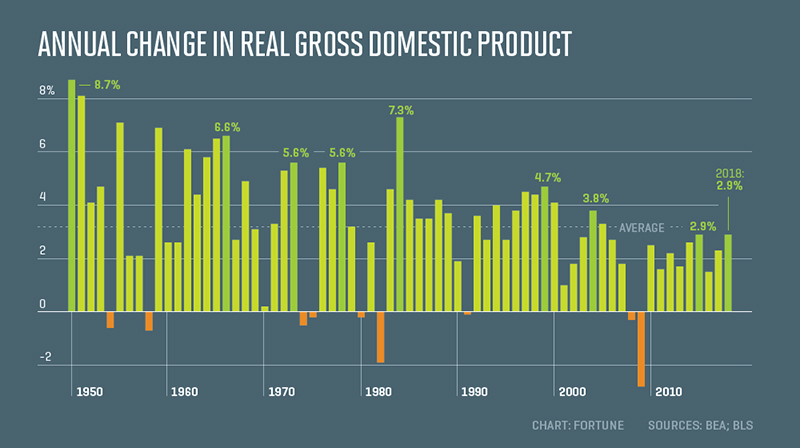
There’s something missing in today’s so-called historically strong economy: blowout GDP numbers. During the last half of the past century, the Department of Commerce released some pretty impressive GDP reports. Here are the highest annual real GDP readings during each decade from 1950 until 2000: 8.7% (1950), 6.6% (1966), 5.6% (1973 and 1978), 7.3% (1984), and 4.7% (1999). Those are hefty numbers compared to the 21st century. Between 2001 and 2010, the highest real GDP recorded was 3.8% (2004), and from 2011 until today the highest yearly rate was 2.9%, which happened twice (2015 and 2018). With an economy as complex as the United States, it’s never one thing, but here are a few elements contributing to tamer numbers on the GDP front. Economic maturity “As we’ve matured as an economy, we consume 65% services,” says Marc Chandler, Chief Market Strategist with Bannockburn Global Forex. “Compare that to China, which has consumed more cement in the last 20 years than the U.S. has for the last 200 years.” That follows a pattern where economies will spend money on fixed capital first, which is a strong stimulus for growth. That includes roads, highways—and houses. “Let’s say you’re starting a family. First, you buy a house, then you buy furniture and TV’s. After that, you buy services.” And that brings us up to today: a largely service economy. “Technology is changing everything,” Chandler says. “GM can now make a car in less than 20 man hours. A guy on the assembly line today is making multiple cars in a fraction of the time his grandfather did. And his hands are touching a computer screen, not touching parts of a car.” He points out that new technology—think the internet and high-tech—saves capital and labor. “So while in the past you might have bought a computer to take the place of a typewriter (which took the place a pen or pencil) now, instead of buying a new computer you can buy new apps.” You get more computing power, but you don’t have to spend as much money. High debt levels Liz Ann Sonders, Chief Market Strategist for Charles Schwab and Co., also blames high levels of debt following the Great Recession. “Not only is this cycle a post-debt bubble cycle—it usually takes a good decade to work out of these—but more broadly, debt levels, especially federal government and business, are in the stratosphere. As debt moves higher and higher, economic growth tends to move lower.” Part of the reason for that is the “crowding out” effect as individuals, companies and the government make payments on the debt. “The higher debt crowds out investment in capital goods,” she says, “reducing economic output relative to what it would be otherwise.” And as many households have spent the past ten years paying down their debt following the financial crisis, “that means spending, which contributes to GDP, lessens.” Changes in the labor force Doug Duncan, Senior Vice President and Chief Economist at Fannie Mae observes that the post-World War II economic expansion was powered by the the movement of ‘Baby Boomers’ into the workforce, as well as household formation. That included the rise of women into the workforce, which peaked around the year 2000. More women entering the labor force created more wage earners, as well as more consumers, and played a role in increasing real GDP. But now, with Boomers turning 65-years-old at the rate of 10,000 each day—male and female—their departure from the workforce is not being fully replaced. Additionally, “immigration has been slowed,” says Duncan, “thus slowing the growth of the workforce as well.” That’s part of the reason why there can be a million and-a-half more job openings (7.4 million according to the BLS Job Openings), significantly more than the number of people who could fill them (there are 5.9 million unemployed people according to Employment Situation). Government regulation Duncan also believes government regulation has put a damper on business investment in recent years, that is until the Trump Administration dramatically slowed regulatory issuance and cut taxes. “That generated the largest ever recorded increase of optimism of small business,” he says, “but the administration also increased spending, adding to an already very high level of debt to GDP. Add to that the uncertainty faced by business investment plans when tariff discussions, which change daily,” and you have a recipe for slowing growth. Whatever the reasons for the slower GDP rates of recent years, not even the Trump Administration predicts GDP on an annual basis as high as 4% in the coming years. And there are some who would argue that higher real GDP rates would increase the risk of a boom and bust cycle anyway. So as the Fed weighs the benefits of lowering interest rates to stimulate growth at the first signs of economic weakening—which may come as soon as the next Fed meeting (July 30th and 31st)—the prospect of blockbuster numbers may remain a fond memory from our country’s younger days. |