什么是“收益率曲线倒挂”?道指大跌800点就因为它!

|
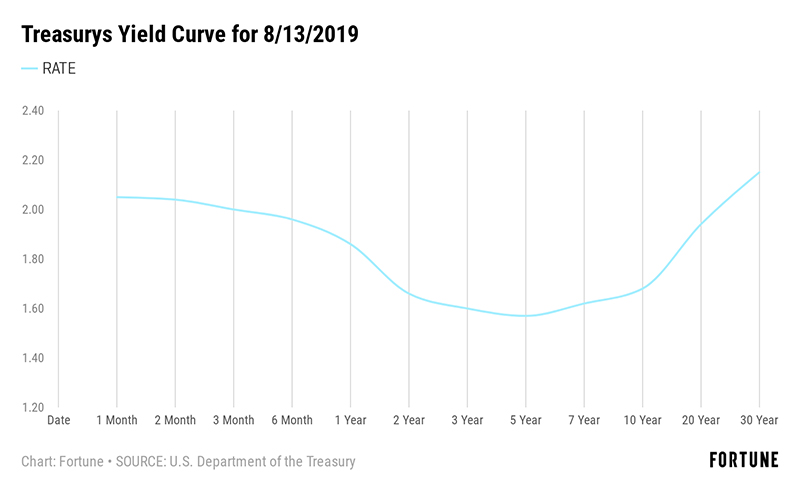
昨夜,美国股市上响起警报,然而拉响警报的只是美国国债利率的微小变化。 美国当地时间周三上午,两年期国债的利率略高于10年期国债利率,该现象就是收益率曲线倒挂。 截至收盘,道琼斯工业指数下跌800点,跌幅3.05%。标普500指数下跌85.72点,跌幅2.93%。纳斯达克指数下跌超过242点,跌幅3.02%。 别看唐纳德·特朗普今天在推特(Twitter)上吐槽收益率曲线太疯狂,要真正理解收益率曲线为何变得如此重要,以及此刻发送的信号是真是假,其实并不容易。 收益率曲线是比较不同期限国债利率的方法,比如说美国国债。在正常市场中,长期债券的利率(也就是收益率)应该高于短期债券的利率,因为投资者买长期债券要锁定更长时间,期望获得更高回报。 收益率曲线是不同期限的利率图,比如3个月、6个月、一年、两年、五年、10年、30年等等。各个点连接成线变成曲线。下图就是例子,反映了2019年8月13日的收益率。 |
Alarms were going off in the stock market today. And what pulled the cord was a slight change in the interest rates of Treasurys. Early Wednesday morning, the interest rate on a 2-year Treasury was slightly higher than the interest on a 10-year, an event called a yield curve inversion. By market close, the Dow industrials were off 800 points, or 3.05%. The S&P 500 was down 85.72 points, which is 2.93%. And the Nasdaq lost more than 242 points, or 3.02%. But understanding why the yield curve has gained such importance—even Donald Trump tweeted about the CRAZY YIELD CURVE today—and whether it’s sending true or false signals at the moment, is a little complicated. Yield curves are a way of comparing the interest rates of the different maturity-date bonds a country issues—like U.S. Treasurys. In a normal market, interest rates (called yields) for longer-term bonds should be higher than those for shorter-term ones, because investors tie their money up for a longer time and want a greater reward for doing so. The yield curve is a graph of the interest rates for varying maturities: like 3-months, 6-months, 1-year, 2-years, 5-years, 10-year, 30-year, and so on. A line is drawn through the plotted points to show a curve. Below is an example for the yields on Aug. 13, 2019. |
|
即便没有出现10年期收益率短暂略低于两年期,该收益率曲线也不正常。 收益率曲线倒挂 通常曲线会向上弯曲,因为图左侧的短期债券到期收益率通常低于右侧的长期到期收益率。 然而有时短期债券的收益率比长期债券高,导致曲线向下弯曲。这被称为收益率曲线倒挂,因为与人们通常期望的相反。 倒挂之所以重要,因为该现象是判断经济衰退即将到来的重要指标。短期利率高于长期利率时,表明未来可能出现经济衰退,因为收益率数字显示投资者认为短期经济比长期经济更有把握。 这种情况下,曲线不会平滑向上,也不会明显下滑,而是中间出现凹陷,而且不只持续一分钟。 之前的倒挂 “通常来说,倒挂发生在衰退12到18个月之前。” Regency Wealth Management公司的合伙人安德鲁·阿兰表示。但倒挂只是指标之一,最近几次倒挂时,之后实际出现经济衰退的几率只有三分之二。 今天的倒挂与过去还不一样。“二战以来美国每一次经济衰退之前,除了2007年以来的经济大衰退,都出现过美联储加息太多太快,远高于当前水平的水平。”马里兰大学的金融学教授大卫·卡斯冷静地分析道。卡斯称大衰退的例子“独一无二”,主要根源是“房地产市场债务过多,楼市和经济崩溃”。 但美联储刚刚宣布降息25个基点,投资者预计到今年年底还会小幅降息多达三次。至于债务方面,“各板块都没有出现债务过多的迹象。”卡斯表示。 到底发生了什么? 上面图表中并未明确显示出倒挂。超短期利率为2.05%,五年期降至1.57%的低点,30年期升至2.15%。长期收益率略高于短期收益率。但两年期至10年期的收益率很低。 “一般来说,有一点不同的是曲线整体呈平缓趋势。”Aviva Investors的投资组合经理蒂姆·阿尔特表示。长期经济趋势方面,人们预期不一定出现问题,但对中期前景感到紧张。“一种解释是,市场认为景气周期放缓的可能性较低,但最终将陷入衰退的可能性较高。”他说。还有人担心,央行在刺激经济方面可能已经无计可施。“值得关注的是,市场越发相信财政政策是唯一能起推动作用的手段。”阿尔特说。 这意味着政治家们应该合作并采取有效措施,可能涉及到采取投入资金刺激经济。但合作很难实现。 其他问题 市场的反应则让许多人困惑。 “理解债券市场反弹很容易理解。” Wedbush Securities的投资组合经理史蒂夫·马绍卡表示。“不过股市下跌很奇怪,而且是各板块集体跳水。” “今天(银行股)遭大举抛售,但贷款定价对短期利率更敏感。”实际情况是短期利率坚挺,阿兰表示。“这可能是另一种过度反应,一早就把银行打倒在地。” 可能根本原因还是神经紧张。与中国和欧盟的贸易争端让许多人恐惧。欧洲经济整体放缓,欧洲和日本仍然维持负利率。随着收益率曲线倒挂,市场似乎把所有事都当成坏消息。 不管是过度悲观,还是投资者神经过敏,都在将市场推向真正的衰退。(财富中文网) 译者:Feb |
This is not a normal yield curve, even without a brief time where the 10-year yield was a little lower than the 2-year. Yield curve inversion Typically, the curve bends upwards because the shorter-term maturities on the left of the graph have lower yields than the long-term maturities toward the right. However, sometimes shorter-term maturities offer higher yields than longer-term ones, resulting in the curve sloping downward from left to right. That’s called a yield curve inversion, because it does the opposite of what people typically expect. Inversion is important because of its status as an indicator of coming economic recessions. When short-term rates are higher than long term, it indicates the potential for a future recession because the numbers indicate that investors think the short-term economy is a better bet than the long term. In this case, instead of a clear climb one way or the other, there’s a dip in the middle—more on that in a minute. Past inversions “Typically these inversions occur 12 to 18 months before a recession,” said Andrew Aran, a partner at Regency Wealth Management. But an inversion is just an indicator, as in recent times, only two-thirds of them have actually come before a recession. But the inversion today is different from the past. “Every recession that we’ve had in the U.S. since World War II, with one exception of the Great Recession, was preceded by the Federal Reserve raising interest rates too far, too fast from much higher levels than the current levels,” said David Kass, clinical professor of finance at the University of Maryland. The Great Recession, which Kass called “one of a kind,” was the result of “an excessive amount of debt in the housing market and the collapse of the housing market and the economy.” But the Fed just dropped the rate by 0.25% and investors expect as many as three more small cuts by the end of the year. As for debt, “I don’t see an excessive amount of debt in any sector,” Kass said. What’s going on? The pattern of the graph above is also not a clear inversion. Very short-term rates start at 2.05%, drop to a low of 1.57% for the 5-year, and then climb to 2.15% for the 30-year. The long-term yield is a bit above the shortest-term. But yields on the 2-year through 10-year are low. “Generally speaking is what is a little different is a broad flattening across the curve,” said Tim Alt, portfolio manager at Aviva Investors. People may not expect trouble in the long run but are nervous about medium-term prospects. “One way to interpret that is the market is pricing in lower odds that this is a mid-cycle slowdown and higher odds that it is going to end up in a recession,” he said. There is also worry that central banks may have run out of tricks to stimulate the economy. “The concern is that the market is moving toward believing that fiscal policy is the only thing to move the needle,” Alt said. That means getting politicians to cooperate and forge useful actions that probably involve spending money to stimulate the economy. Such cooperation is going to be hard to find. Other concerns But the market’s response has left many scratching their heads. “I certainly understand the rally in [bonds],” said Steve Massocca, portfolio manager at Wedbush Securities. “The decline in equities is a mystery. And it’s across the board.” “[Bank stocks] are being sold aggressively today, but their pricing on their loans is more sensitive to short rates” and short rates are holding, Aran said. “That seems to be possibly another over reaction, taking the banks behind the woodshed at an early point.” It may all come down to a case of nerves. Trade disputes with China and the EU are scaring many. Economies across Europe have slowed, with negative interest rates still in place there and in Japan. The markets seem primed to take everything at the moment as bad news, as the yield curve enters new territory. Either that or jittery investors are about to talk themselves into a recession. |