

美国银行顶级策略师表示,美股现在“更接近1995年”
WILL DANIEL
2024-04-08
这位资深策略师指出,高估值的大型科技股掩盖了整体市场的真实估值。
 文本设置
文本设置
 Plus(0条)


由于经济数据出乎意料地强劲,加上投资者对人工智能的热情,标准普尔500指数在过去12个月里上涨了32%,一些专家担心股市存在泡沫。美国银行美国股票和量化策略主管萨维塔·苏布拉马尼安绝对不是其中之一,但在近日将标准普尔500指数的年终目标价从5000点上调至5400点后,她采取了相对不同寻常的举措,称她听到了不少看空市场的声音。
苏布拉马尼安在一份报告中表示,自从她做出看涨的判断以来,“整整一周都收到反馈和反对意见”,其中包括有人在电话会议上直接提问:“萨维塔,你预测会进入泡沫区域吗?”苏布拉马尼安坚持认为,这个问题的答案是否定的,而且她已经准备好解决这一问题。
在美国银行研究中心发布的一份常见问题解答中,这位资深分析师解释说,尽管人们对潜在的非理性市场繁荣感到担忧,但之前的市场泡沫通常都有几大关键因素——主要是“股指价格与内在价值之间的差距较大”和“投机行为猖獗”——而当前的市场不符合这些条件。她写道:“2007年的房地产泡沫、2000年的科技股泡沫、1637年的郁金香泡沫都符合这些条件。但如今的标准普尔500指数并非如此。”
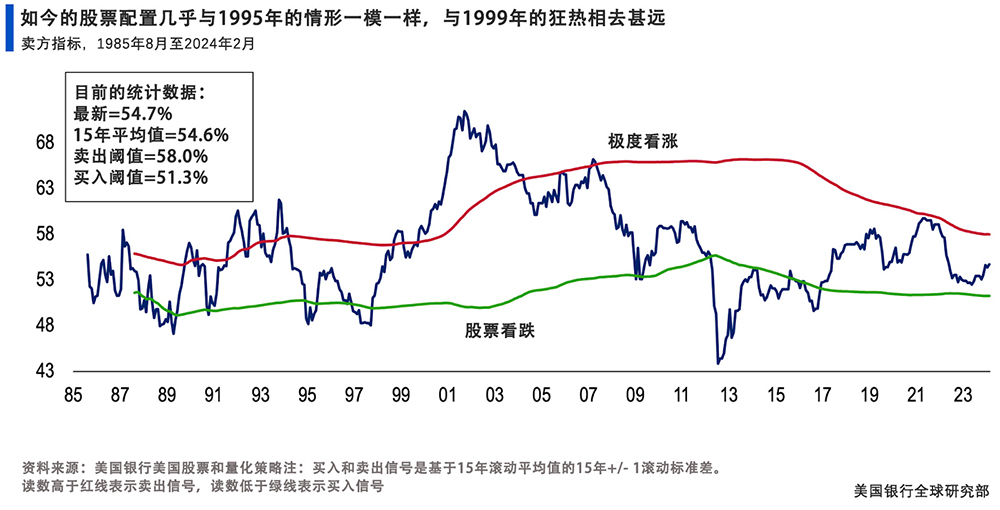
尽管如此,随着人工智能热潮不断推高科技股,这就让人回想起互联网时代,一些华尔街专家将其与互联网泡沫相提并论。如今,人们正在争论,如今的情况是1995年的情景重演,那时科技股牛市才刚刚开始,还是更像1999年的情景重演,崩盘就在眼前。
苏布拉马尼安向读者保证,在她看来,现在“更像1995年的情景重演”。从投资者相对低迷的情绪水平,到不断提高的生产力和大型科技公司领导的基本面优势,现在还未进入泡沫区域。
股票被高估了,属实吗?
第一条批评苏布拉马尼安看涨标准普尔500指数的预测与市场估值有关。美国银行的数据显示,标准普尔500指数目前的远期市盈率约为20.5倍,而1986年以来的平均远期市盈率为15.8倍。
苏布拉马尼安承认:“基于快照市盈率,价格与内在价值之间的差距很大。但在我们看来,旧‘七巨头’(Magnificent Seven)指数(苹果、微软、Alphabet、亚马逊、英伟达、特斯拉和Meta)的市盈率更接近长期平均水平,更重要的是,如今的指数与过去几十年的指数缺乏可比性。”
这位资深策略师指出,高估值的大型科技股掩盖了整体市场的真实估值。在她看来,包括微软(Microsoft)、谷歌(Google)、苹果(Apple)、英伟达(Nvidia)、特斯拉(Tesla)、Meta和亚马逊(Amazon)在内的“七巨头”的过去12个月市盈率约为38倍,而标准普尔500指数整体市盈率为23倍。
苏布拉马尼安还指出,标准普尔500指数的成分股与过去大不相同,这使得将该指数的估值与历史平均水平进行比较参考价值并不大。
“估值很重要。但考虑到该指数的组合变化,将目前的历史市盈率与过去几十年的历史市盈率进行比较意义不大。如今标准普尔500指数的杠杆率是过去几十年的一半,质量更高,收益波动性与过去几十年相似或更低。”
但投资者是否过于乐观?
任何股市泡沫的第二个最常见特征就是兴奋。在过去12个月里,以英伟达(Nvidia)278%的涨幅为首的人工智能股飙升,让一些人认为投资者热情高涨,但苏布拉马尼安用美国银行的一些数据反驳了这一观点。
她指出,美国股票投资者的兴奋点被“圈定”在人工智能等主题上,但整体情绪“远未达到此前市场高峰期的看涨水平”。事实上,根据美国银行的数据,投资者情绪正处于1995年的水平。苏布拉马尼安写道:“尽管我们听到有人反驳市场情绪'全面看涨',但市场情绪是中性的。”
总体而言,在苏布拉马尼安看来,尽管股市在过去一年飙升,标准普尔500指数“缺乏泡沫迹象”。"在我们看来,这轮牛市还有上涨空间。”她写道,并补充道,"如今的情况是1995年的情景重演,而非1999年。”
熊市观点
虽然苏布拉马尼安认为2024年股市将再创辉煌,但总有看跌者发出警告。Tidal Financial Group的投资组合经理迈克尔·盖德(Michael Gayed)对《傻瓜投资指南》(The Motley Fool)表示,“我们遇到了很多麻烦,所有泡沫都会终结”。
投资银行对真正的泡沫并不那么担心,但也有一些知名人士看跌,包括摩根士丹利(Morgan Stanley)首席投资长兼首席美国股票策略师麦克·威尔逊(Mike Wilson),他预计标准普尔500指数未来12个月将下跌约12%,至4500点。威尔逊并不认为我们正处于泡沫之中,但他指出,自去年10月以来,标准普尔500指数“历史性”上涨了25%,其中90%是由估值上升推动的,而不是盈利增加。
这位首席投资官在一份报告中解释说,他认为今年市场是由“模糊性”和“流动性”驱动的,这意味着投资者应该对回调保持警惕。
至于市场等式的模糊性部分,威尔逊指出,经济和股市“相互矛盾的数据”可能会引起担忧。强劲的经济增长与低迷的盈利;股市估值上升与美联储更加鹰派的立场;这些都不是你所期望的典型组合。经济增长通常会推动企业实现盈利,而加息的威胁应该会降低股市估值。那么,是什么造成了这些相互矛盾的数据呢?
威尔逊写道:“我们认为,从经济、盈利和业绩的角度来看,目前的政策组合解释了许多难以调和的脱节现象。”
摩根士丹利首席信息官表示,联邦政府通过《通货膨胀削减法案》和《芯片和科学法案》的支出正在推动私营建筑和制造业公司加大支出,并进行人员招聘,从而保持经济增长活力。但这些支出存在一个问题,可以解释为什么收益不如最近的经济数据那么强劲:“虽然这些计划有助于保持经济增长,但也挤占了私营部门的空间,因为它们影响了劳动力、材料和资本的成本。”威尔逊说。
因此,威尔逊的“模糊性”—— 或者说经济数据点与股市数据点相互矛盾——在一定程度上可以用联邦政府支出的增加来解释。但威尔逊表示,等式的第二部分是流动性,这有助于解释股市表现强劲与盈利增长相对疲弱之间的差异。
这就是逆回购机制的作用所在。为了帮助支付联邦政府的巨额预算赤字,美联储允许私营公司赚取少许额外的钱,通常是通过中介机构,而且基本上是通过隔夜贷款给美联储。这些公司买入美国国债,然后同意日后以更高价格卖出,赚取收益,但在短期内为美联储提供现金。这是美联储用来为短期利率设定下限的工具,但也会导致流动性上升。威尔逊解释说:“在我们看来,这种流动性推动了资产价格的普遍上涨,而且股票市场/资产类别中一些投机性较强的领域占据主导地位。”
威尔逊关于模糊性和流动性的论点长篇累牍,但简而言之,就是让投资者“谨慎行事”,因为推动市场上涨的因素可能无法持续。威尔逊总结说:“随着市场更好地掌握这些动态,如今的盈利/基本面有可能出现更实质性的改善。”(财富中文网)
译者:中慧言-王芳
由于经济数据出乎意料地强劲,加上投资者对人工智能的热情,标准普尔500指数在过去12个月里上涨了32%,一些专家担心股市存在泡沫。美国银行美国股票和量化策略主管萨维塔·苏布拉马尼安绝对不是其中之一,但在近日将标准普尔500指数的年终目标价从5000点上调至5400点后,她采取了相对不同寻常的举措,称她听到了不少看空市场的声音。
苏布拉马尼安在一份报告中表示,自从她做出看涨的判断以来,“整整一周都收到反馈和反对意见”,其中包括有人在电话会议上直接提问:“萨维塔,你预测会进入泡沫区域吗?”苏布拉马尼安坚持认为,这个问题的答案是否定的,而且她已经准备好解决这一问题。
在美国银行研究中心发布的一份常见问题解答中,这位资深分析师解释说,尽管人们对潜在的非理性市场繁荣感到担忧,但之前的市场泡沫通常都有几大关键因素——主要是“股指价格与内在价值之间的差距较大”和“投机行为猖獗”——而当前的市场不符合这些条件。她写道:“2007年的房地产泡沫、2000年的科技股泡沫、1637年的郁金香泡沫都符合这些条件。但如今的标准普尔500指数并非如此。”
尽管如此,随着人工智能热潮不断推高科技股,这就让人回想起互联网时代,一些华尔街专家将其与互联网泡沫相提并论。如今,人们正在争论,如今的情况是1995年的情景重演,那时科技股牛市才刚刚开始,还是更像1999年的情景重演,崩盘就在眼前。
苏布拉马尼安向读者保证,在她看来,现在“更像1995年的情景重演”。从投资者相对低迷的情绪水平,到不断提高的生产力和大型科技公司领导的基本面优势,现在还未进入泡沫区域。
股票被高估了,属实吗?
第一条批评苏布拉马尼安看涨标准普尔500指数的预测与市场估值有关。美国银行的数据显示,标准普尔500指数目前的远期市盈率约为20.5倍,而1986年以来的平均远期市盈率为15.8倍。
苏布拉马尼安承认:“基于快照市盈率,价格与内在价值之间的差距很大。但在我们看来,旧‘七巨头’(Magnificent Seven)指数(苹果、微软、Alphabet、亚马逊、英伟达、特斯拉和Meta)的市盈率更接近长期平均水平,更重要的是,如今的指数与过去几十年的指数缺乏可比性。”
这位资深策略师指出,高估值的大型科技股掩盖了整体市场的真实估值。在她看来,包括微软(Microsoft)、谷歌(Google)、苹果(Apple)、英伟达(Nvidia)、特斯拉(Tesla)、Meta和亚马逊(Amazon)在内的“七巨头”的过去12个月市盈率约为38倍,而标准普尔500指数整体市盈率为23倍。
苏布拉马尼安还指出,标准普尔500指数的成分股与过去大不相同,这使得将该指数的估值与历史平均水平进行比较参考价值并不大。
“估值很重要。但考虑到该指数的组合变化,将目前的历史市盈率与过去几十年的历史市盈率进行比较意义不大。如今标准普尔500指数的杠杆率是过去几十年的一半,质量更高,收益波动性与过去几十年相似或更低。”
但投资者是否过于乐观?
任何股市泡沫的第二个最常见特征就是兴奋。在过去12个月里,以英伟达(Nvidia)278%的涨幅为首的人工智能股飙升,让一些人认为投资者热情高涨,但苏布拉马尼安用美国银行的一些数据反驳了这一观点。
她指出,美国股票投资者的兴奋点被“圈定”在人工智能等主题上,但整体情绪“远未达到此前市场高峰期的看涨水平”。事实上,根据美国银行的数据,投资者情绪正处于1995年的水平。苏布拉马尼安写道:“尽管我们听到有人反驳市场情绪'全面看涨',但市场情绪是中性的。”
总体而言,在苏布拉马尼安看来,尽管股市在过去一年飙升,标准普尔500指数“缺乏泡沫迹象”。"在我们看来,这轮牛市还有上涨空间。”她写道,并补充道,"如今的情况是1995年的情景重演,而非 1999年。”
熊市观点
虽然苏布拉马尼安认为2024年股市将再创辉煌,但总有看跌者发出警告。Tidal Financial Group的投资组合经理迈克尔·盖德(Michael Gayed)对《傻瓜投资指南》(The Motley Fool)表示,“我们遇到了很多麻烦,所有泡沫都会终结”。
投资银行对真正的泡沫并不那么担心,但也有一些知名人士看跌,包括摩根士丹利(Morgan Stanley)首席投资长兼首席美国股票策略师麦克·威尔逊(Mike Wilson),他预计标准普尔500指数未来12个月将下跌约12%,至4500点。威尔逊并不认为我们正处于泡沫之中,但他指出,自去年10月以来,标准普尔500指数“历史性”上涨了25%,其中90%是由估值上升推动的,而不是盈利增加。
这位首席投资官在一份报告中解释说,他认为今年市场是由“模糊性”和“流动性”驱动的,这意味着投资者应该对回调保持警惕。
至于市场等式的模糊性部分,威尔逊指出,经济和股市“相互矛盾的数据”可能会引起担忧。强劲的经济增长与低迷的盈利;股市估值上升与美联储更加鹰派的立场;这些都不是你所期望的典型组合。经济增长通常会推动企业实现盈利,而加息的威胁应该会降低股市估值。那么,是什么造成了这些相互矛盾的数据呢?
威尔逊写道:“我们认为,从经济、盈利和业绩的角度来看,目前的政策组合解释了许多难以调和的脱节现象。”
摩根士丹利首席信息官表示,联邦政府通过《通货膨胀削减法案》和《芯片和科学法案》的支出正在推动私营建筑和制造业公司加大支出,并进行人员招聘,从而保持经济增长活力。但这些支出存在一个问题,可以解释为什么收益不如最近的经济数据那么强劲:“虽然这些计划有助于保持经济增长,但也挤占了私营部门的空间,因为它们影响了劳动力、材料和资本的成本。”威尔逊说。
因此,威尔逊的“模糊性”—— 或者说经济数据点与股市数据点相互矛盾——在一定程度上可以用联邦政府支出的增加来解释。但威尔逊表示,等式的第二部分是流动性,这有助于解释股市表现强劲与盈利增长相对疲弱之间的差异。
这就是逆回购机制的作用所在。为了帮助支付联邦政府的巨额预算赤字,美联储允许私营公司赚取少许额外的钱,通常是通过中介机构,而且基本上是通过隔夜贷款给美联储。这些公司买入美国国债,然后同意日后以更高价格卖出,赚取收益,但在短期内为美联储提供现金。这是美联储用来为短期利率设定下限的工具,但也会导致流动性上升。威尔逊解释说:“在我们看来,这种流动性推动了资产价格的普遍上涨,而且股票市场/资产类别中一些投机性较强的领域占据主导地位。”
威尔逊关于模糊性和流动性的论点长篇累牍,但简而言之,就是让投资者“谨慎行事”,因为推动市场上涨的因素可能无法持续。威尔逊总结说:“随着市场更好地掌握这些动态,如今的盈利/基本面有可能出现更实质性的改善。”(财富中文网)
译者:中慧言-王芳
With unexpectedly strong economic data and investors’ AI enthusiasm driving the S&P 500 32% higher over the past 12 months, some experts are worried that the stock market is in a bubble. Bank of America head of U.S. equity and quantitative strategy Savita Subramanian definitely isn’t one of them, but after raising her year-end price target for the S&P 500 from 5,000 to 5,400 last week, she took the relatively unusual step of saying she’d heard from quite a few market bears.
Subramanian said in a Monday note that she had a “full week of feedback and pushback” since making her bullish call, including a direct question on a call that went something like: “Savita, are you forecasting a bubble?” The answer to that question is no, Subramanian insists—and she’s ready to address the concern.
In an FAQ issued by Bank of America Research, the veteran analyst explained that despite all the fears over a potentially irrationally exuberant market, prior market bubbles have typically featured a few key factors—mainly “a gap between price and intrinsic value” and “rampant speculation”—and the current market doesn’t fit the bill. “Housing in 2007, tech in 2000, tulips in 1637 are examples that tick these boxes. But the S&P 500 today does not,” she wrote.
Still, with AI fervor harkening back to the internet era as it pushes some tech stocks ever higher, a few Wall Street experts have made comparisons to the dotcom bubble. Now, there’s an argument over whether we’re repeating 1995, and the tech bull run is just getting started, or whether it’s more like 1999, and a crash is right around the corner.
Subramanian reassured readers that, in her view, it’s “more 1995.” From investors’ relatively subdued sentiment levels to rising productivity and the fundamental strength of Big Tech leadership, this isn’t a bubble just yet.
Stocks are overvalued, right?
The first criticism of Subramanian’s bullish prediction for the S&P 500 has to do with market valuations. The S&P 500 currently trades at roughly 20.5 times forward earnings, compared with an average of 15.8 since 1986, according to BofA data.
“The gap between price and intrinsic value is high, based on snapshot P/E multiples,” Subramanian admitted. “But the ex–Magnificent Seven trades closer to long-term average multiples, and, more importantly, today’s index lacks comparability to prior decades’, in our view.”
The veteran strategist noted that highly valued Big Tech stocks are obscuring the true valuation of the overall market. To her point, the Magnificent Seven—a group that includes Microsoft, Google, Apple, Nvidia, Tesla, Meta, and Amazon—trade at roughly 38 times their trailing 12-month earnings, compared with 23 times for the S&P 500 as a whole.
Subramanian also pointed out that the S&P 500’s constituents are quite different from what they used to be, which makes comparing the index’s valuation with its historical average less valuable.
“Valuation matters. But comparing a trailing P/E today to a trailing P/E of prior decades makes little sense given the index’s mix shiſt,” she wrote. “Today’s S&P 500 is half as levered, is higher quality, and has similar or lower earnings volatility than in prior decades.”
But are investors too euphoric?
The second most common feature in any stock market bubble is euphoria. And surging AI stocks, led by the 278% rise in Nvidia over the past 12 months, have some arguing that investors are pretty enthusiastic, but Subramanian used some of BofA’s data to push back on that idea.
She noted that U.S. equity investors’ excitement has been “ring-fenced” to themes like AI, but overall sentiment is “nowhere near bullish levels of prior market peaks.” In fact, investor sentiment is right around where it was in 1995, according to BofA data. “Sentiment is neutral despite pushback we hear that sentiment is ‘full bull,’” Subramanian wrote.
Overall, for Subramanian, despite the stock market’s surge over the past year, the S&P 500 “lacks signs” of a bubble. “In our view, this bull market has legs,” she wrote, adding “today is 1995, not 1999.”
The bears’ take
While Subramanian has made the case for the stock market to experience another banner year in 2024, there are always bears dishing out warnings. Just this week, Michael Gayed, a portfolio manager at Tidal Financial Group, told The Motley Fool that “we’re in a lot of trouble” and that “all bubbles end.”
Investment banks aren’t as worried about a true bubble, but there are a few big-name bears out there, including Morgan Stanley’s chief investment officer and chief U.S. equity strategist, Mike Wilson, who sees the S&P 500 dropping roughly 12% to 4,500 over the next 12 months. Wilson isn’t arguing we’re in a bubble, but he notes that 90% of the S&P 500’s “historic” 25% rally since October has been driven by rising valuations instead of improving earnings.
The CIO explained in a Monday note that he believes the market is being driven by “ambiguity” and “liquidity” this year, which means investors should remain vigilant for a correction.
As for the ambiguity part of the market equation, Wilson pointed to “conflicting data” in the economy and stock market that could be cause for concern. Strong economic growth with muted earnings; rising stock market valuations with a more hawkish Fed; these aren’t the typical combinations that you’d expect. Economic growth usually drives corporate earnings, and the threat of higher rates is supposed to decrease stock market valuations. So what’s to blame for the conflicting data?
“We think the current policy mix explains many of the disconnects that have been hard to reconcile from an economic, earnings, and performance standpoint,” Wilson wrote.
Federal government spending via the Inflation Reduction Act and CHIPS Act is driving spending and hiring by private construction and manufacturing companies, keeping economic growth alive, according to the Morgan Stanley CIO. But there’s an issue with this spending that could explain why earnings aren’t as strong as recent economic data: “While these programs are helping to keep the economy humming, they are also crowding out the private sector as they impact the cost of labor, materials, and capital,” Wilson said.
So Wilson’s “ambiguity”—or conflicting data points in the economy compared with the stock market—can partly be explained by rising federal government spending. But the second part of the equation is liquidity, which helps to explain the difference in the stock market’s strong performance compared with its relatively muted earnings growth, according to Wilson.
This is where the reverse repo facility comes in. In order to help pay for the federal government’s large budget deficit, the Federal Reserve allows private sector companies to earn a little extra money, often through an intermediary, by essentially lending money to the Federal Reserve overnight. These companies buy U.S. Treasuries and then agree to sell them back at a higher price at a later date, earning yield but providing the Fed with cash over a short term. This is used as a tool by the Fed to put a floor under short-term interest rates, but it also leads to rising liquidity. “In our view, that liquidity has helped to elevate asset prices broadly, led by some of the more speculative areas of the equity market/asset classes,” Wilson explained.
Wilson’s ambiguity and liquidity argument is a long, detailed way of saying “be careful” to investors, because the factors driving market gains may not be sustainable. “With these dynamics now better understood by the market, the burden is now likely on earnings/fundamentals to show more material improvement,” Wilson concluded.
请打开财富Plus APP