

买进的好时机:美股或许已回归公允价值
SHAWN TULLY
2020-03-26
周期调整市盈率排除了突然出现的波动,因此能更准确地体现股票的价值
 文本设置
文本设置
 Plus(0条)

我一直在想这种事是否真有可能发生。席勒周期调整市盈率(P/E)在七年多内首次达到了长期平均水平。这可能是一个信号,意味着在新型冠状病毒引发股市暴跌之后,现在的市场整体上是买进的好时机。
这可能是一个重要的里程碑,因为诺贝尔奖得主和耶鲁大学教授罗伯特·席勒提供了一种最好的指标,可用来衡量股价过低、过高还是处在合理区间内。这个著名的指标名为周期调整市盈率,简称CAPE。CAPE指标的优点在于,它不同于标准市盈率,并不依赖过去四个季度报告的最近年化收益数据。以本期利润为分母很容易产生误导,因为按照标准市盈率公式计算,在盈利衰退期会夸大市盈率,但实际上股票价格很低;当利润达到不可持续的极高水平时,又会低估股票的实际价值。
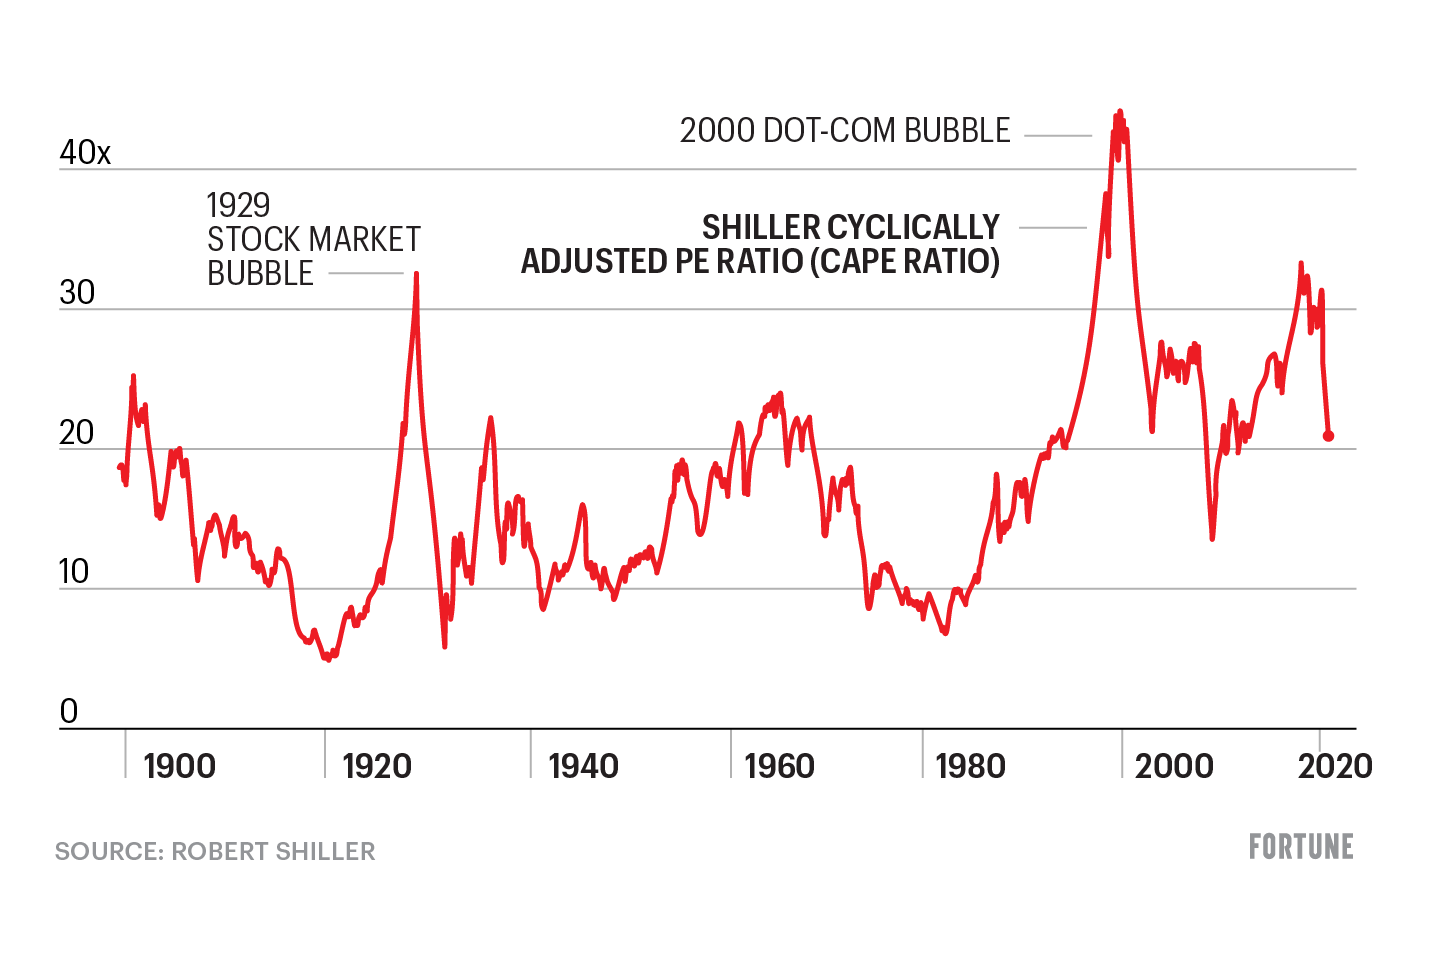
席勒的指标计算的是过去10年的平均通胀调整后收益。这种计算方式排除了突然出现的波动,因此能更准确地体现股票的价值,因为如果根据本期收益计算,这种突然波动会使市盈率数据失真。
最近一段时间,企业利润出现了不可持续的泡沫,使股票看起来虽然价格较高但没有高到离谱,而实际上已经非常昂贵。我们会看到,CAPE指标就不会出现这样的错误。
过去50年,CAPE的中位数倍数是20.3倍。根据席勒提出的107美元的每股调整后收益,标普指数在2172点才算达到其长期正常估值水平(107美元每股收益乘以20.3)。长期正常估值可以作为CAPE的关键基准。3月23日星期一,标普指数收于2237点,与2172点只相差不到3%,在中午交易时段一度相差不到1%。值得注意的是,在特朗普当选的2016年11月8日,标普指数收盘时的水平,比今天所谓的公允价值高出1.5%。
当CAPE超过25倍的时候,即比半个世纪的中位数高约20%,通常会发生两件事,这或许能给我们带来启发。首先,在未来的某个时间点,CAPE通常都会回落到20倍以下;其次,回落的过程非常漫长。例如,1966年1月,CAPE接近25倍,在1969年年中之前一直维持在20至25倍之间。
后来,CAPE下降到十几倍甚至个位数,直到1995年才恢复到25倍。之后,CAPE一直高于该水平,直到2008年金融危机爆发,CAPE倍数大幅下降。2014年8月,CAPE重新恢复到25倍,在今年年初以前一直维持在25至35倍之间的高点。2月底的CAPE为30.8倍,比20.3倍的历史平均值高出52%。
新型冠状病毒疫情使CAPE出现了史上速度最快、幅度最大的下滑,在3月23日回落到50年基准水平。根据CAPE衡量,投资者抛售股票使市场进入了所谓的“正常”水平,这对于认为当前股票价格被严重低估的观点提出了质疑。没有人知道CAPE倍数从较高点回落到20.3倍需要多长时间,但这一天终究会到来。或许,这次历史性的暴跌只是让股市回归到它一直以来应有的水平:公允价值。(财富中文网)
翻译:刘进龙
审校:汪皓
我一直在想这种事是否真有可能发生。席勒周期调整市盈率(P/E)在七年多内首次达到了长期平均水平。这可能是一个信号,意味着在新型冠状病毒引发股市暴跌之后,现在的市场整体上是买进的好时机。
这可能是一个重要的里程碑,因为诺贝尔奖得主和耶鲁大学教授罗伯特·席勒提供了一种最好的指标,可用来衡量股价过低、过高还是处在合理区间内。这个著名的指标名为周期调整市盈率,简称CAPE。CAPE指标的优点在于,它不同于标准市盈率,并不依赖过去四个季度报告的最近年化收益数据。以本期利润为分母很容易产生误导,因为按照标准市盈率公式计算,在盈利衰退期会夸大市盈率,但实际上股票价格很低;当利润达到不可持续的极高水平时,又会低估股票的实际价值。
席勒的指标计算的是过去10年的平均通胀调整后收益。这种计算方式排除了突然出现的波动,因此能更准确地体现股票的价值,因为如果根据本期收益计算,这种突然波动会使市盈率数据失真。
最近一段时间,企业利润出现了不可持续的泡沫,使股票看起来虽然价格较高但没有高到离谱,而实际上已经非常昂贵。我们会看到,CAPE指标就不会出现这样的错误。
过去50年,CAPE的中位数倍数是20.3倍。根据席勒提出的107美元的每股调整后收益,标普指数在2172点才算达到其长期正常估值水平(107美元每股收益乘以20.3)。长期正常估值可以作为CAPE的关键基准。3月23日星期一,标普指数收于2237点,与2172点只相差不到3%,在中午交易时段一度相差不到1%。值得注意的是,在特朗普当选的2016年11月8日,标普指数收盘时的水平,比今天所谓的公允价值高出1.5%。
当CAPE超过25倍的时候,即比半个世纪的中位数高约20%,通常会发生两件事,这或许能给我们带来启发。首先,在未来的某个时间点,CAPE通常都会回落到20倍以下;其次,回落的过程非常漫长。例如,1966年1月,CAPE接近25倍,在1969年年中之前一直维持在20至25倍之间。
后来,CAPE下降到十几倍甚至个位数,直到1995年才恢复到25倍。之后,CAPE一直高于该水平,直到2008年金融危机爆发,CAPE倍数大幅下降。2014年8月,CAPE重新恢复到25倍,在今年年初以前一直维持在25至35倍之间的高点。2月底的CAPE为30.8倍,比20.3倍的历史平均值高出52%。
新型冠状病毒疫情使CAPE出现了史上速度最快、幅度最大的下滑,在3月23日回落到50年基准水平。根据CAPE衡量,投资者抛售股票使市场进入了所谓的“正常”水平,这对于认为当前股票价格被严重低估的观点提出了质疑。没有人知道CAPE倍数从较高点回落到20.3倍需要多长时间,但这一天终究会到来。或许,这次历史性的暴跌只是让股市回归到它一直以来应有的水平:公允价值。(财富中文网)
翻译:刘进龙
审校:汪皓
I’ve been wondering if it would actually happen. For the first time in more than seven years, the Shiller price/earnings ratio, or P/E, is flirting with its long-term average. This could be a signal that, at long last, the overall market—in its coronavirus-driven collapse––is now a good buy.
This event could prove a landmark, because Robert Shiller, the Nobel Prize winner and Yale professor, offers what’s arguably the best yardstick for measuring whether stocks are cheap, expensive, or sit somewhere in the reasonable range. Shiller calls his famed metric the CAPE, for cyclically adjusted price/earnings ratio. The CAPE’s beauty is that unlike the standard P/E, it doesn’t rely on the most recent annualized earnings numbers reported over the past four quarters. Using current profits as the denominator is highly misleading, because that formula inflates the P/E in an earnings recession, when stocks are actually bargains, and understates how rich they really are when profits hit unsustainable lofty levels.
Instead, Shiller calculates an average of inflation-adjusted earnings over the past 10 years. That provides a truer reading of value because it takes out the careening swings that distort P/Es based on current earnings.
Recently, corporate profits reached an unsustainable bubble, making stocks look like pricey but not excessively so, when in reality they were really, really expensive. As we’ll see, the CAPE didn’t make that mistake.
Over the past 50 years, the median multiple on the CAPE is 20.3. Based on Shiller’s adjusted earnings number of $107 per share, the S&P would reach 2172 at its normal long-term valuation ($107 in EPS multiplied by 20.3). On Monday, March 23, the S&P closed at 2237. At that point, the index sat within less than 3% of what might be termed a key benchmark for the CAPE. At midday, the difference was less than 1%. Remarkably, the S&P was 1.5% higherat the close on the day Trump was elected, Nov. 8, 2016, than what could be considered today’s fair value.
It’s instructive that two things occur when the CAPE soars over 25, which is almost 20% above the half-century median. First, it always falls back through that 20-plus mark at some point in the future, and second, that fall may take a long, long time. For example, the CAPE neared 25 in January of 1966, and stayed in the low-20s until mid-1969.
The CAPE then languished in the low-double and single digits until 1995, when it finally climbed back to 25. It stayed above that level until it collapsed during the financial crisis starting in 2008. It wasn’t until August 2014 that the CAPE hit 25 again, and it remained at rarefied heights in the high-20s and low-30s until early this year. At the end of February, it stood at 30.8, 52% above its historic reading of 20.3.
The coronavirus pandemic unleashed the deepest, quickest drop in the CAPE’s history, bringing it back to that 50-year benchmark on March 23. That the selloff led markets to what could be called a “normal” level, based on the CAPE, casts doubt on the view that shares are now radically underpriced. You never know how long it will take for an elevated CAPE to wend its way back to 20.3. But it always gets there. It may well be that this historic plunge simply got us back to a place where we should have been all along: fair value.
请打开财富Plus APP