

为什么比特币能超6000美元?看图表便知
Jen Wieczner
2017-10-25
比特币价格屡创新高,追涨者自有理由。
 文本设置
文本设置
 Plus(0条)

|
上周五比特币价格首次突破6000美元关口,或许你觉得已错过买入机会,但看完以下观点你可能会改变想法。 上周真是过山车一般。仅在本月比特币价格涨幅已超过42%,较三天前的低点也涨了20%,其收益足令任何一只股票汗颜,也让不断发出警告声的摩根大通首席执行官杰米·戴蒙和前任美联储主席本·伯南克打脸。上周六中午,比特币成交价接近6200美元。如今,不少投资者都很烦躁,担心如果继续观望会错过一辈子难得的发财机会。 当然了,历史上传奇地位的投资大佬们,比如沃伦·巴菲特都建议资产价格高的时候不要追涨,都说赚钱最好的方法是低价买入,当然更好是成功卖高。但一位颇具影响力的分析师兼投资者做了张图,解释为何他认为比特币价格还能继续涨。遭遇下个拐点之前最高可触及7400美元。 |
If you thought you missed your chance to buy Bitcoin when the price broke $6,000 for the first time Friday, there’s one argument that might convince you otherwise. It’s not for the faint of heart. But with the Bitcoin price up more than 42% this month alone, and up 20% from its low just three days ago, the cryptocurrency’s returns have beaten just about everything available on the stock market, defying repeated warnings from the likes of J.P. Morgan CEO Jamie Dimon and former Fed chair Ben Bernanke. As of midday Saturday, Bitcoin was trading at nearly $6,200. Now, investors are fretting they’ll miss out on the windfall of a lifetime if they wait any longer. Historically, of course, legendary investors such as Warren Buffett have advised against buying assets when their price is high, arguing that the best way to make money is to buy low, and, ideally, sell high. Yet a chart created by an influential analyst and investor illustrates why he predicts the Bitcoin price could go higher still — and in fact, may reach as high as $7,400 before its next significant dip. |
|
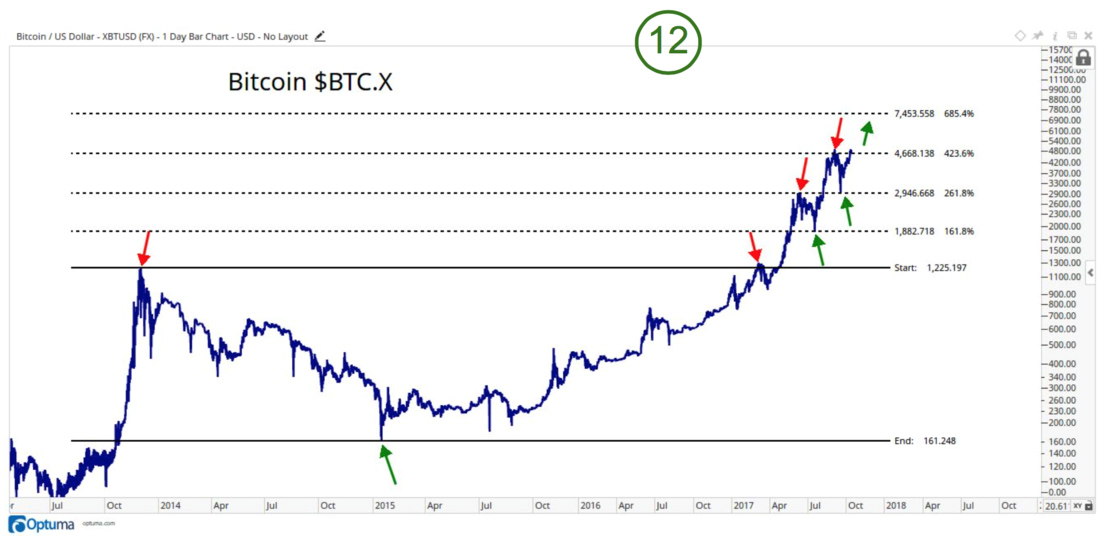
一位技术行业分析师表示,比特币价格走势图类似接近完美的斐波那契数列,意味着币价可能进一步走高。 比特币走势图基于技术分析,这种方法略有争议,因为买入决策完全基于某只股票或某种资产的动态,不考虑基本估值,也不看相关公司或证券未来的机会。有些投资者抵制这种方法,认为这是在试图预测市场,这点可是出了名的难。但证据显示该分析方法有时比较准。 如果要说技术分析最适用的地方,可能就是比特币了,比特币价格跟公司无关,也没联上任何货币或资产,连实际应用都没关系。此外,比特币价格基本上反映了炒作和对长期潜力的抽象预期,所以价格不仅起伏无定,还常有不太寻常的波状走势,爱好者称之为“波动”,创新高之前调整30%都很正常。 这种情况下,市场技术分析师,也是All Star Charts总裁兼创始人 JC Parets观察发现,比特币价格每隔一段时间上升的规律类似斐波那契数列,这种数列是著名的数学现象,自然界里也很常见,从贝壳的内部螺旋花纹到松果都符合规律。 “说起斐波那契数列,嘿,比特币走势难道还不够明显?”上周Parets在Stocktoberfest论坛发表演讲时说,该论坛由金融社交媒体Stocktwits在加州科罗纳多举办。按照斐波那契数列规则,下一段波动的长度等于前两个波段长度之和。Parets在之前绘制的图表中显示,比特币从超过2013年高点后持续反弹,基本符合规律,即每段上涨的百分比都可按斐波那契数列准确预测。 “看看,简直一点不差,” Parets补充说。他又用下表进一步说明。 |
The Bitcoin price chart mirrors a near-perfect Fibonacci sequence, a sign that the cryptocurrency could rise higher still, according to technical analysis. Chart by JC Parets, All Star Charts The Bitcoin chart relies on technical analysis, a field of investing that is somewhat controversial because buying decisions are based on the movement of a particular stock or other asset, rather than on the fundamental valuation or future opportunity of the underlying company or security. While some investors reject this approach as trying to time the market — a notoriously difficult task — there is evidence that it can sometimes pay off. And if there were ever a time to use technical analysis, it might be with Bitcoin, whose price is not tied to any company, nor pegged to any other currency or asset, nor even related to an actual use case. What’s more, the Bitcoin price, which largely trades on hype and abstract visions of its long-term potential, is not only exceptionally volatile, but tends to trade in an unusual undulating formation that enthusiasts have come to call “waves” — where a correction of as much as 30% is common between new highs. In this case, JC Parets, a chartered market technician who is the president and founder of All Star Charts, observed that the price of Bitcoin has moved upward at intervals resembling the Fibonacci sequence, a famous mathematical pattern that also occurs in nature in everything from the inner spiral of a seashell to pinecones. “Talk about Fibonacci—I mean, dude, does it get any cleaner than this?” Parets said last week in a presentation at the Stocktoberfest conference, hosted by the financial social media site Stocktwits in Coronado, Calif. With Fibonacci, the length of the next segment is equal to the sum of the two preceding segments. In Parets’ chart above, he shows that Bitcoin’s rallies, since the price surpassed its 2013 high, have followed a similar pattern, where each new leg up corresponds to a percentage increase as predicted by the Fibonacci series. “I mean, guys, this is like to the penny,” Parets added. He breaks it down further in the chart below. |
|
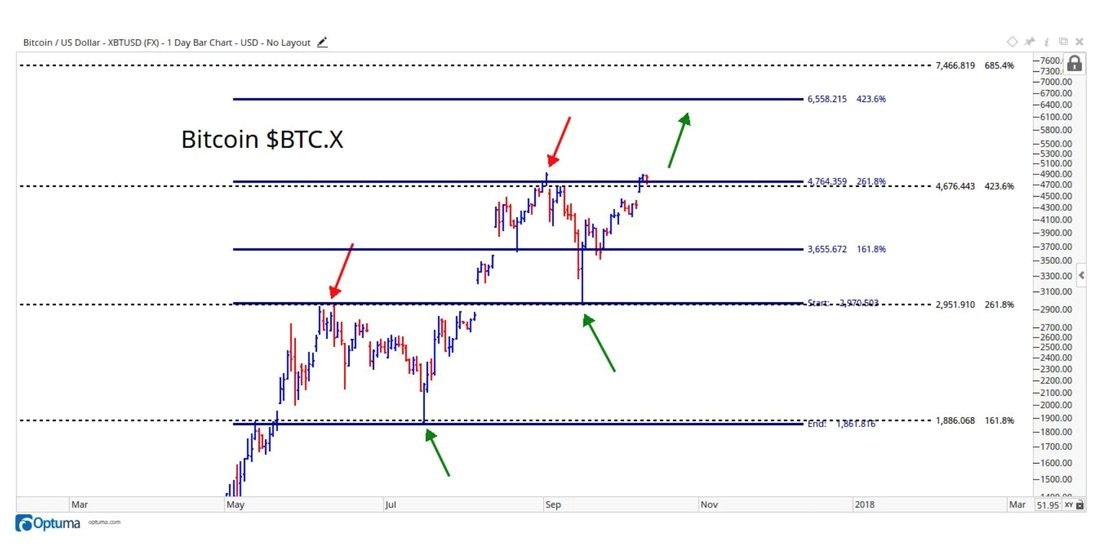
比特币每次反弹,价格上涨的幅度都可用著名的数学公式斐波那契数列准确预测。 不过Parets表示,这一规律仅在比特币价格高于4700美元左右时适用。但只要能一直保持高位,他相信币价可以涨到至少7400美元以上。目前Parets对比特币的预期价还相对保守:6500美元。 “其实比特币涨到三倍还是跌倒一文不值,我一点也不关心,真的不关心。不过从风险回报角度来看,我更希望涨,”他表示。“如果币价一直在4700美元以上,可以按6500美元的目标价做多,风险回报率还是很高的,之后再跌到0美元吧!” 补充说明一点:Parets对比特币价格的预估并未指明具体时间,也就是说可能会立刻发生,也可能会花上几年,只要一直遵从斐波那契数列就行。 “是的,理论上说今晚就可能涨到目标价,”比特币价格突破6000美元时他对《财富》杂志表示。“谁知道呢?”(财富中文网) 译者:Charlie 审校:夏林 |
With each new Bitcoin rally, its price has moved up in predictable increments corresponding to the Fibonacci sequence, a famous mathematical pattern. The prediction only holds, Parets maintains, if the Bitcoin price remains above roughly $4,700. But as long as it does, he believes Bitcoin could rise to at least about $7,400, as indicated in the chart. For now, though, Parets is giving Bitcoin a more conservative price target: $6,500. “I don’t care if Bitcoin triples or goes to zero, I really don’t care at all, but from a risk-reward standpoint, I love it long,” he said. “If we’re above $4,700, we want to be long with a target of $6,500 — that’s a great risk-reward, let it go to zero after that!” One caveat: Parets’ Bitcoin price prediction does not have any timeline attached, which means it could happen imminently, or not for years — as long as it continues to mirror the Fibonacci sequence. “Yes, theoretically, it can hit our targets tonight,” he told Fortune after Bitcoin passed the $6,000 mark. “Who knows?” |
请打开财富Plus APP