穆迪看衰美国楼市,半数城市降价20%以上
当然,穆迪分析(Moody’s Analytics)的首席经济师马克·赞迪并不赞同上述看法。今年5月,赞迪就对《财富》杂志做出了一个大胆的预测:疫情房产热已经见顶,而且我们将进入“房产修正期”。在这期间,与房贷利率3%挂钩的房市将向供求平衡迈进。期间,房屋销量将急剧下滑。赞迪表示,在此期间,美国大部分地区都会出现房价修正风险。
从9月的情形来看,赞迪的房产市场修正预言似乎完全正确。不仅房产活动出现了大面积的下滑,同时在一些市场,例如奥斯汀和博伊西,房价也出现了下滑。上周,美联储(Federal Reserve)的主席杰罗姆·鲍威尔承认,美国房产市场将进入“艰难的修正期。”
尽管如此,赞迪的看法愈发悲观。8月,穆迪分析下调了美国房产市场展望。穆迪分析预计,美国房价从峰值到谷底的跌幅区间为0至5%,而价格严重“高估”房产市场的跌幅区间为5%至10%。8月的预测并没有考虑经济衰退因素。如果经济进入下行通道,穆迪分析预计美国房价的跌幅就将达到5%至10%,而价格严重“高估”房产市场的跌幅将达到15%至20%。
仅仅一个月之后,穆迪分析再次下调了这一房市下行展望。
穆迪分析如今预计美国房价从峰值到谷底的跌幅区间为5%至10%。在价格严重“高估”的房产市场,预测的跌幅为10%至15%。如果发生经济衰退,穆迪分析预计美国房价跌幅就将扩大至10%至15%,而价格严重“高估”的房产市场的跌幅将达到20%至25%。
假设美国房价下跌15%,显然这一跌幅并不能够彻底抹除美国房价在疫情房产热期间出现的惊人的43%增幅。然而,它将是二战后出现的第二高房价跌幅,仅次于美国房价在2006年至2012年房产泡沫破灭期间出现的27%的跌幅。
如果美国房价确实出现双位数跌幅,《财富》杂志将把疫情房产热重新称之为疫情房产泡沫(Pandemic Housing Bubble)。
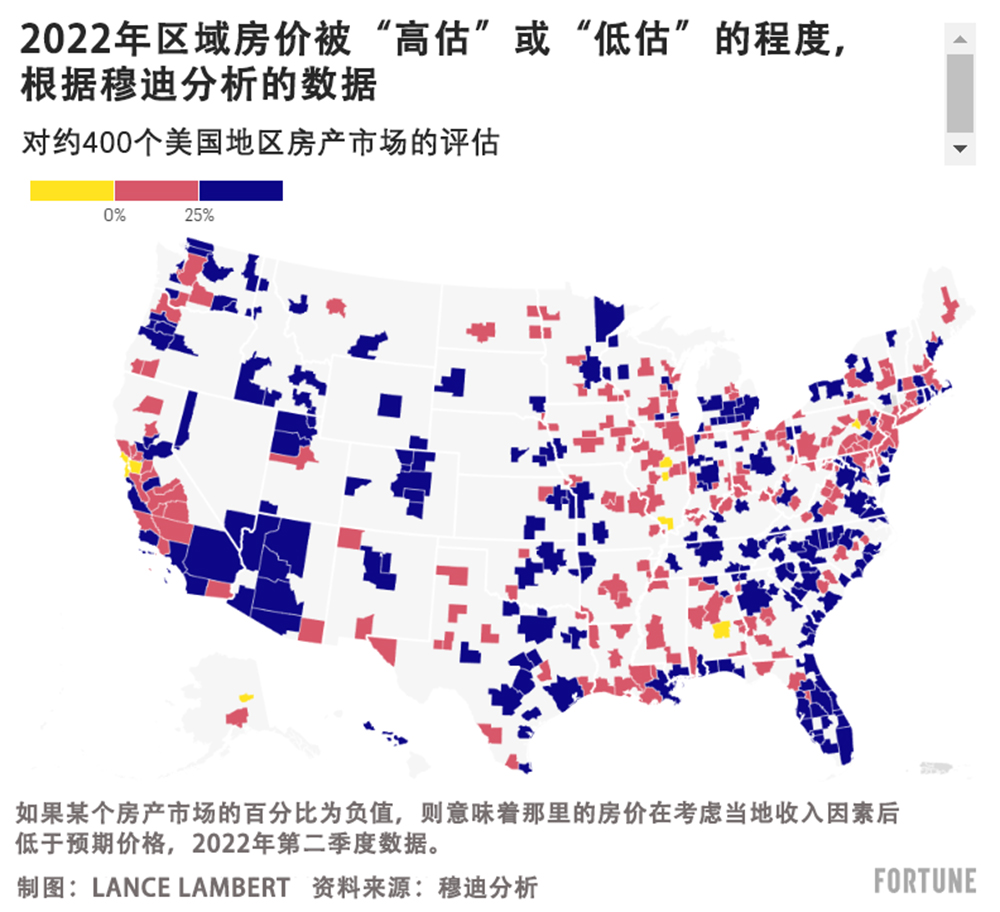
这些价格被严重“高估”的市场都在哪?实际上,几乎无处不在。
每一个季度,穆迪分析都会评估当地经济基本面是否能够支撑当地房产价格,其中包括当地收入水平。*如果某个房产市场被“高估”的幅度超过了25%,穆迪分析就认为其价格被“严重高估”。2022年第一季度,在全美413个最大的地区房产市场中,有183个的高估幅度超过了25%。第二季度,这个数字增长到了210个。
在疫情房产热早期阶段,这些泡沫市场主要集中在阳光带地区和西山地区新兴城镇。然而,随着房产热进入2022年,很多西海岸、中西部和东北地区的房产市场也开始出现了价格泡沫。

从历史上来看,泡沫房产市场(即严重“高估”的市场)在房市修正期出现房价下跌的风险最高。正因为如此,穆迪分析每一个季度都会对分析进行更新。
如果房价修正(受房贷利率大幅上涨3个百分点的刺激)在两年前发生,那么就可能会存在房价下跌风险的房产市场数量就会少得多。在2019年第二季度(见上图),仅有三个首要房产市场被认为严重“高估”。
简而言之:在不到三年的时间中,美国房市从历史上平易近人的房市(见下图)变成了历史上令人敬而远之的房市。

当然,这场房价修正运动已经启动了。受影响最严重的莫过于两种房产市场。
第一种属于奥斯汀(5月至8月房产价值下跌了7.4%)、博伊西(下滑5.3%)、丹佛(下滑4.3%)和菲尼克斯(下滑4.4%)这类泡沫市场。这些市场的一些买家来自于旧金山和纽约这类城市,个个财大气粗。在他们的推动下,这些地区的房价已经远超历史上当地居民收入可以承受的范围。这些正是被穆迪分析视为存在高风险的房产市场。
第二种属于西雅图(5月至8月房价下跌了3.8%)旧金山(下滑7.8%)和圣何塞(下滑10.6%)这类高成本科技中心。假如考虑当地收入,这些市场并不属于被严重“高估”的范畴。然而,这些市场会遭受双重噩梦的打击。首先,这里的高端房产市场对利率更加敏感,其次,其所处的科技领域亦是如此。
这些房产市场何时才会触底?赞迪称,此次房价修正可能会持续12个月至18个月。
穆迪分析的首席经济师马克·赞迪写道:“穆迪分析房屋估值方法是实际房价与符合历来人均薪资和建造成本的房价之间的百分比差值。房价最终由用于修建房屋的土地价格决定,而且与按照薪资以及房屋建造成本衡量的土地机会成本挂钩。在全美范围内,房屋约一半的价值来自于土地,另一半价值取决于结构,但不同地区存在着巨大差异。比如在旧金山,土地在房屋价值中的占比最大,而且大得离谱,在爱荷华州得梅因,情形刚好相反。我们的房产估值方法亦考虑了这些差异。”(财富中文网)
译者:冯丰
审校:夏林
有鉴于有利的千禧一代人口结构,房产库存的吃紧以及较低的失业率,房地产看涨人士称,疫情房产热(Pandemic Housing Boom)还有更多的上行空间。
当然,穆迪分析(Moody’s Analytics)的首席经济师马克·赞迪并不赞同上述看法。今年5月,赞迪就对《财富》杂志做出了一个大胆的预测:疫情房产热已经见顶,而且我们将进入“房产修正期”。在这期间,与房贷利率3%挂钩的房市将向供求平衡迈进。期间,房屋销量将急剧下滑。赞迪表示,在此期间,美国大部分地区都会出现房价修正风险。
从9月的情形来看,赞迪的房产市场修正预言似乎完全正确。不仅房产活动出现了大面积的下滑,同时在一些市场,例如奥斯汀和博伊西,房价也出现了下滑。上周,美联储(Federal Reserve)的主席杰罗姆·鲍威尔承认,美国房产市场将进入“艰难的修正期。”
尽管如此,赞迪的看法愈发悲观。8月,穆迪分析下调了美国房产市场展望。穆迪分析预计,美国房价从峰值到谷底的跌幅区间为0至5%,而价格严重“高估”房产市场的跌幅区间为5%至10%。8月的预测并没有考虑经济衰退因素。如果经济进入下行通道,穆迪分析预计美国房价的跌幅就将达到5%至10%,而价格严重“高估”房产市场的跌幅将达到15%至20%。
仅仅一个月之后,穆迪分析再次下调了这一房市下行展望。
穆迪分析如今预计美国房价从峰值到谷底的跌幅区间为5%至10%。在价格严重“高估”的房产市场,预测的跌幅为10%至15%。如果发生经济衰退,穆迪分析预计美国房价跌幅就将扩大至10%至15%,而价格严重“高估”的房产市场的跌幅将达到20%至25%。
假设美国房价下跌15%,显然这一跌幅并不能够彻底抹除美国房价在疫情房产热期间出现的惊人的43%增幅。然而,它将是二战后出现的第二高房价跌幅,仅次于美国房价在2006年至2012年房产泡沫破灭期间出现的27%的跌幅。
如果美国房价确实出现双位数跌幅,《财富》杂志将把疫情房产热重新称之为疫情房产泡沫(Pandemic Housing Bubble)。
这些价格被严重“高估”的市场都在哪?实际上,几乎无处不在。
每一个季度,穆迪分析都会评估当地经济基本面是否能够支撑当地房产价格,其中包括当地收入水平。*如果某个房产市场被“高估”的幅度超过了25%,穆迪分析就认为其价格被“严重高估”。2022年第一季度,在全美413个最大的地区房产市场中,有183个的高估幅度超过了25%。第二季度,这个数字增长到了210个。
在疫情房产热早期阶段,这些泡沫市场主要集中在阳光带地区和西山地区新兴城镇。然而,随着房产热进入2022年,很多西海岸、中西部和东北地区的房产市场也开始出现了价格泡沫。
从历史上来看,泡沫房产市场(即严重“高估”的市场)在房市修正期出现房价下跌的风险最高。正因为如此,穆迪分析每一个季度都会对分析进行更新。
如果房价修正(受房贷利率大幅上涨3个百分点的刺激)在两年前发生,那么就可能会存在房价下跌风险的房产市场数量就会少得多。在2019年第二季度(见上图),仅有三个首要房产市场被认为严重“高估”。
简而言之:在不到三年的时间中,美国房市从历史上平易近人的房市(见下图)变成了历史上令人敬而远之的房市。
当然,这场房价修正运动已经启动了。受影响最严重的莫过于两种房产市场。
第一种属于奥斯汀(5月至8月房产价值下跌了7.4%)、博伊西(下滑5.3%)、丹佛(下滑4.3%)和菲尼克斯(下滑4.4%)这类泡沫市场。这些市场的一些买家来自于旧金山和纽约这类城市,个个财大气粗。在他们的推动下,这些地区的房价已经远超历史上当地居民收入可以承受的范围。这些正是被穆迪分析视为存在高风险的房产市场。
第二种属于西雅图(5月至8月房价下跌了3.8%)旧金山(下滑7.8%)和圣何塞(下滑10.6%)这类高成本科技中心。假如考虑当地收入,这些市场并不属于被严重“高估”的范畴。然而,这些市场会遭受双重噩梦的打击。首先,这里的高端房产市场对利率更加敏感,其次,其所处的科技领域亦是如此。
这些房产市场何时才会触底?赞迪称,此次房价修正可能会持续12个月至18个月。
穆迪分析的首席经济师马克·赞迪写道:“穆迪分析房屋估值方法是实际房价与符合历来人均薪资和建造成本的房价之间的百分比差值。房价最终由用于修建房屋的土地价格决定,而且与按照薪资以及房屋建造成本衡量的土地机会成本挂钩。在全美范围内,房屋约一半的价值来自于土地,另一半价值取决于结构,但不同地区存在着巨大差异。比如在旧金山,土地在房屋价值中的占比最大,而且大得离谱,在爱荷华州得梅因,情形刚好相反。我们的房产估值方法亦考虑了这些差异。”(财富中文网)
译者:冯丰
审校:夏林
Favorable millennial demographics. Tight housing inventory. Low unemployment. That’s why housing bulls said the Pandemic Housing Boom had more room to run.
Moody’s Analytics chief economist Mark Zandi, of course, disagreed. Back in May, Zandi came to Fortune with a bold proclamation: The Pandemic Housing Boom had peaked and we were entering into a “housing correction.” A housing correction being a period where the housing market—which got priced to 3% mortgage rates—would work towards equilibrium. It’d see home sales volumes fall sharply. It’d also, Zandi said, put much of the nation at risk of a home price corrections.
Fast forward to September, and it looks like Zandi’s housing correction call was spot-on. Not only is housing activity declining across the board, but some markets, like Austin and Boise, are already seeing falling home prices. Last week, Fed Chair Jerome Powell acknowledged that the U.S. housing market is entering into a “difficult correction.”
That said, Zandi’s views are shifting—downward. In August, Moody’s Analytics downgraded their U.S. housing market outlook. Peak-to-trough, Moody’s Analytics expected U.S. home prices to fall between 0% to 5%, and fall between 5% to 10% in significantly “overvalued” housing markets. That August forecast assumed no recession. If an economic downturn manifested, Moody’s Analytics expected U.S. home prices to fall between 5% to 10%. While significantly “overvalued” housing markets would fall 15% to 20%.
Just a month later, Moody’s Analytics is already revising that bearish housing market outlook downward.
Peak-to-trough, Moody’s Analytics now expects U.S. home prices to fall between 5% to 10%. In significantly “overvalued” housing markets, that forecasted drop is now between 10% to 15%. If a recession hits, Moody’s Analytics expects that U.S. home price decline to widen to 10% to 15%, and the drop in significantly “overvalued” housing markets to range between 20% to 25%.
Let’s say that U.S. home prices decline 15%. That hypothetical drop wouldn’t fully erase the staggering 43% jump in U.S. home prices we saw during the Pandemic Housing Boom. However, it would be the second biggest home price decline of the post-World War II era. Only the bursting housing bubble, which saw U.S. home prices decline 27% between 2006 and 2012, would have it beat.
If U.S. home prices do indeed fall by a double-digit amount, Fortune would relabel the Pandemic Housing Boom to the Pandemic Housing Bubble.
Where can we find these significantly "overvalued" housing markets? Well, just about everywhere.
Every quarter, Moody’s Analytics assesses whether local economic fundamentals, including local income levels, can support local house prices.* If a housing market is “overvalued” by more than 25%, Moody’s Analytics deems it “significantly overvalued.” Through the first quarter of the year, 183 of the nation’s 413 largest regional housing markets were overvalued by more than 25%. In the second quarter of 2022, that figure grew to 210 regional housing markets.
During the early phase of the Pandemic Housing Boom these frothy markets were heavily concentrated in Sun Belt and Mountain West boomtowns. However, as the housing boom carried over into 2022, many markets on the West Coast, Midwest, and Northeast also began to reach frothy valuations.
Historically speaking, frothy housing markets (i.e. significantly "overvalued" markets) are at the highest risk of home price declines during a housing market correction. After all, that's why Moody's Analytics updates the analysis each quarter.
If this housing correction—which was spurred by a 3 percentage point jump in mortgage rates—had occurred two years ago, far fewer housing markets would've been at risk of home price declines. Back in the second quarter of 2019 (see chart above), just three major regional housing markets were considered significantly "overvalued."
Simply put: In just under three years, the U.S. housing market went from a historically affordable housing market (see chart below) to a historically unaffordable housing market.
This home price correction, of course, has already started. It's hitting two groups the hardest.
The first group includes frothy markets like Austin (where home values fell 7.4% between May and August), Boise (down 5.3%), Denver (down 4.3%), and Phoenix (down 4.4%). Those markets saw deep-pocketed WFH buyers from cities like San Francisco and New York drive home prices far beyond what local incomes would historically support. These are exactly the types of places Moody's Analytics deems high risk.
The second group are high-cost tech hubs like Settle (where home values fell 3.8% between May and August), San Francisco (down 7.8%), and San Jose (10.6%). Relative to local incomes, those markets are not significantly "overvalued." Those tech hubs are, however, hit by a double whammy. Not only are their high-end real estate markets more rate-sensitive, but so are their tech sectors.
When will these housing markets bottom out? According to Zandi, it could take another 12 to 18 months before this home price correction concludes.
"The Moody’s Analytics housing valuation measure is the percent difference between actual house prices and house prices historically consistent with wages and salaries per capita and construction costs. The price of a house is ultimately determined by the value of the land upon which it resides which is tied to the opportunity cost of the land as measured by wages and salaries, and the cost to build the home. Nationwide, approximately one-half of a home’s value is the land and the other half the structure, but this varies considerably across the country. In San Francisco, for example, the land is far and away the biggest part of the home’s value, while in Des Moines, Iowa, it is the opposite. Our housing valuation measure accounts for these differences," writes Moody's Analytics chief economist Mark Zandi.